


Stock Market Toppy and Trendless
Stock-Markets / Stock Index Trading Oct 05, 2009 - 01:38 AM GMTBy: Steven_Vincent

 Overall, the evidence is mounting that some kind of a top in equities and commodities and some kind of a bottom in the US Dollar is in the process of being produced. Short term, an oversold condition and a spike in bearishness may combine with the proclivity of traders to buy every dip off the March bottom with abandon producing a bounce to resistance. What happens then will be very telling. A period of indecision and trendless, choppy trading is likely as either a top is created or markets break out again. This is a good time to be on the sidelines waiting for the markets to resolve in either direction.
TECHNICAL ANALYSIS
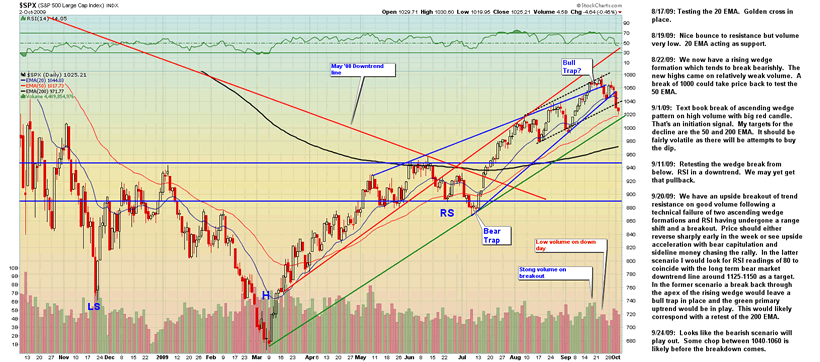
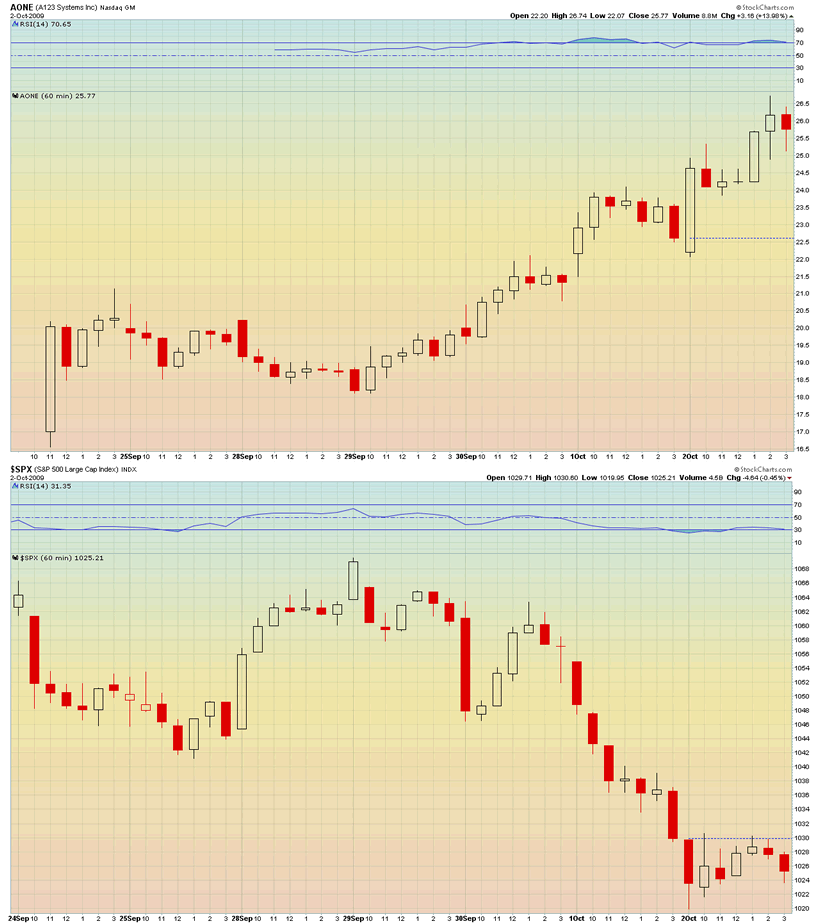
The S&P 500 (SPX) remains in bull trend but that trend was very nearly tested last week. The "throw over" bull trap is suggestive of a top. There is no way at this time to know what kind of a top this may be. It may be a short term pullback within an ongoing uptrend or it may be the beginning of something more significant. In any case I think that there is sufficient evidence that a period of consolidation or decline may be upon us and traders are best waiting for the market to set up for its next big primary move. After a run this strong it is likely that a lot of back and forth action will ensue as either a top in put in place or a consolidation is produced. I think an immediate, strong move in either direction is not likely. Friday saw some substantial dip buying activity on the bad jobs report so we may have put in a short term bottom. Let's look at an hourly chart for additional clues:
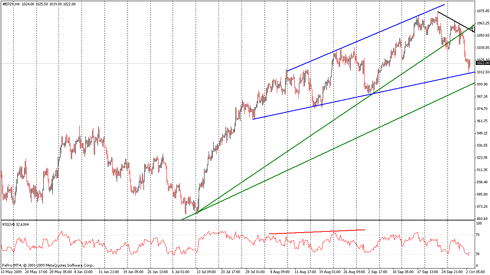
Price has yet to challenge the primary trendline from the March bottom and touched the bottom rail of an expanding range formation, which is generally a topping pattern. The rising wedge formation from the July bottom has been broken decisively and is further suggestive of additional downside. We have also seen a lower high and a lower low, so we have a downtrend on the hourly chart. My sense is that we will see the zone of the wedge break retested in the 1058 area. The Put-Call Ration is coming in quite high at this point though the 14 day moving average still has plenty of move to room to the upside before we can say there is too much fear in the market.
We can see that a similar spike in CPC produced a bounce in the SPX but it took a much higher level in the 14 day MA to produce the July bottom.
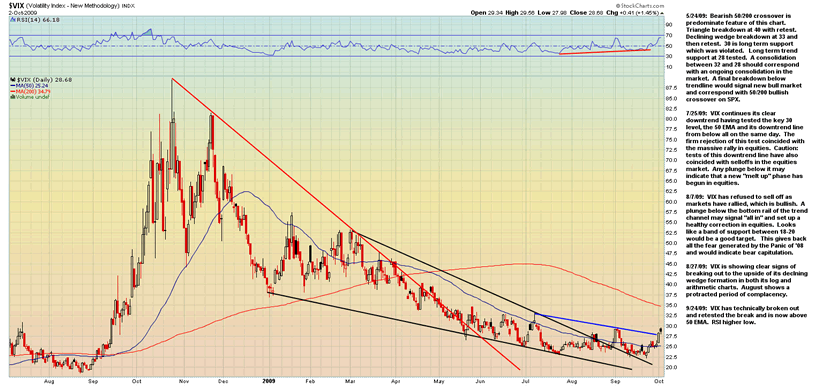
The VIX has broken out rather decisively, which should be bearish for stocks, but a retest of the break would correspond with a short term bounce for stocks.
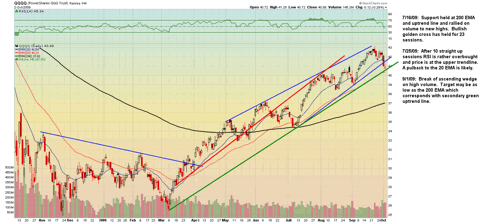
The Nasdaq 100 (QQQQ), which has been the leading sector in the rally, is actually in much greater danger of violating its primary trend than the broad market.
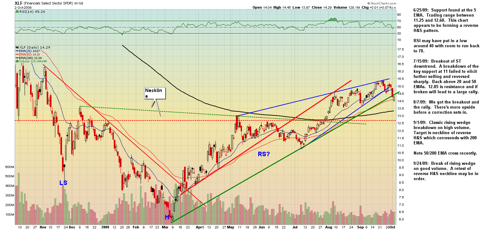
The Financial sector (XLF), which also led the surge off the March bottom, has actually violated trend.
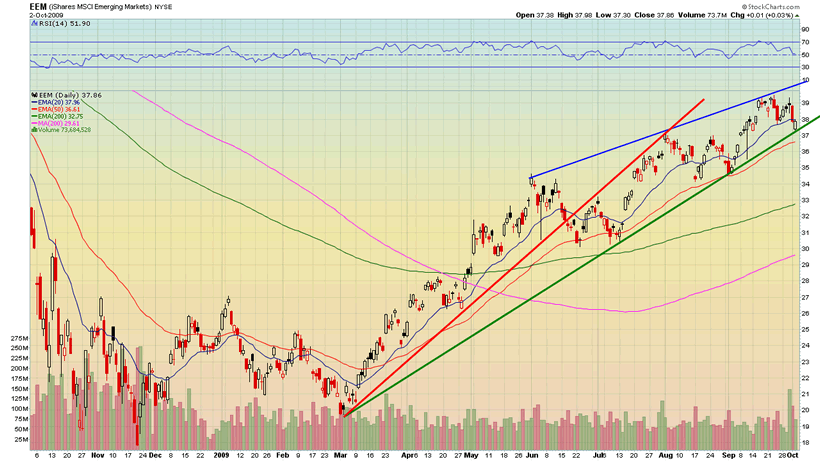
Emerging markets are also challenging their primary uptrend.
The Shanghai market needs to bounce immediately or it risks a very ...h configuration. A weekly close below the 200 EMA and a lower low will put a downtrend in place.
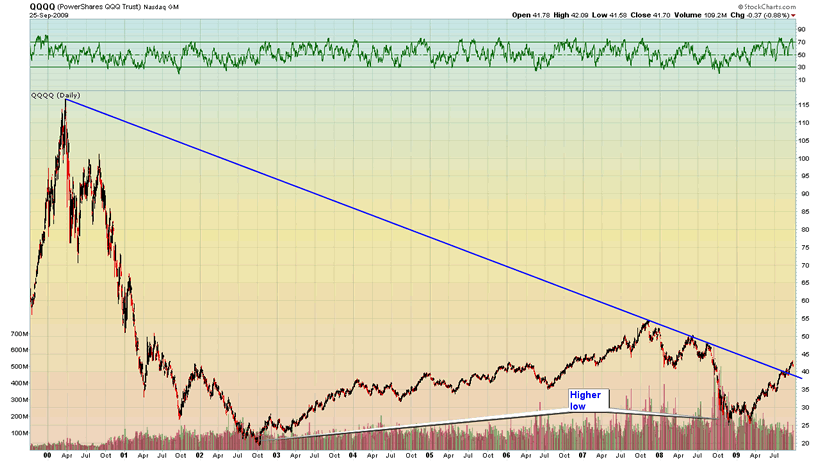
The Nasdaq 100 (QQQQ) has broken its 9 year bear downtrend. Will it now retest the breakout? Will the retest be successful?
There was a recent IPO in the emerging Green Tech sector, battery maker A123 Systems (AONE). It's interesting that the stock has performed very well in spite of a selloff in the broad market. Is this a glimpse of the future New Technology Bull?
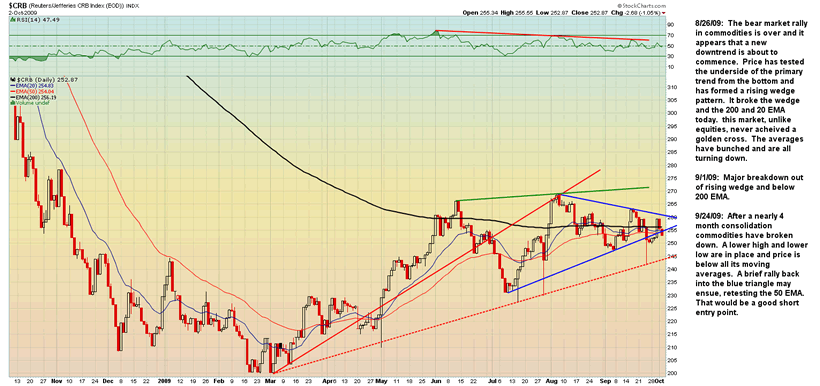
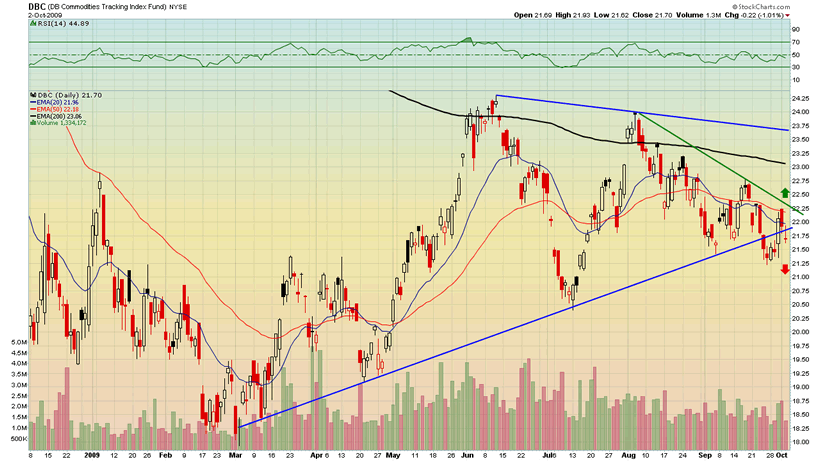
The CRB Commodities Index has gone less than nowhere in the last 4 months, has made a lower high and has broken down from a consolidation triangle. All of its moving averages are turing down and price is trading below them. If the Inflationist view were valid wouldn't we be seeing commodity prices in a clear uptrend? The DBC commodities ETF looks even worse, trading well below its 200 EMA.
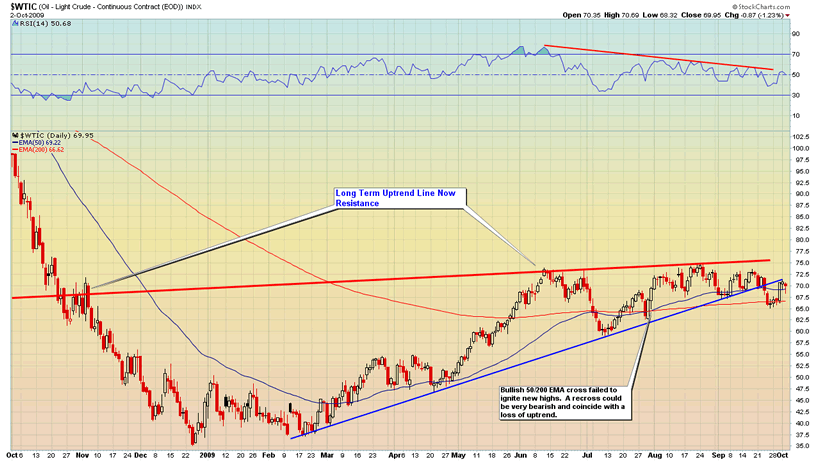
Crude Oil has violated trend and come back to retest the break. Price would need to rally above the lower trend line soon in order to avoid the commencement of a downtrend.
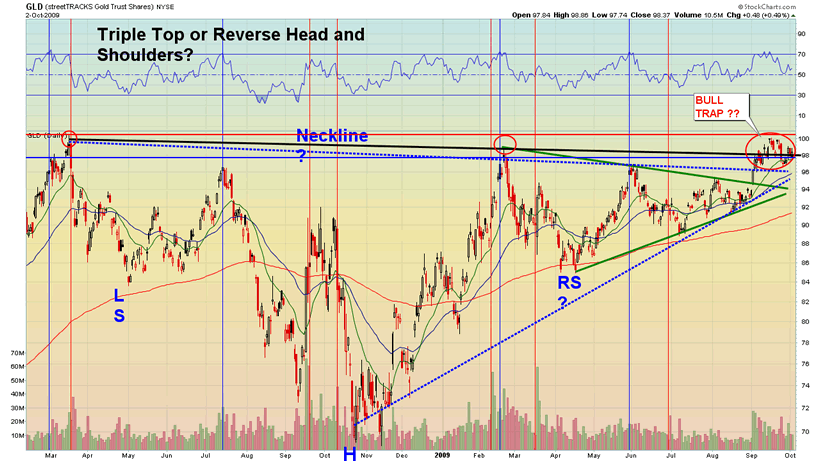
Precious metals investors need to be aware that the technical scenario on gold as well as the broader market context makes the probability very high for a nasty reversal from a bull trap here. A failure back through the apex of the blue or green triangles will likely end the bull market in precious metals. Support at GLD 94 must hold. A break above 100 will initiate a new impulse leg higher.
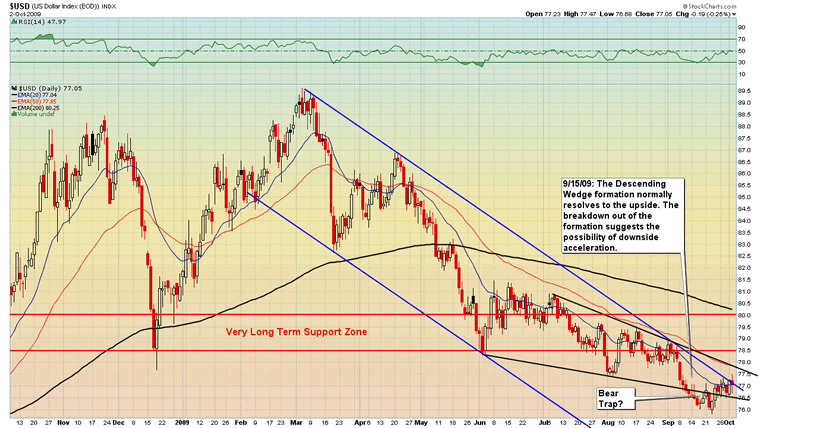
The dollar is testing its downtrend and the downside break of the descending wedge failed to follow through. An upside breakout is likely to eventually occur. At this time there are a growing number of voices which are calling for the same. We may need to see a retest of the recent bottom to silence some of that bullishness before we get the breakout.
Let's look at some of the components of the US dollar index.
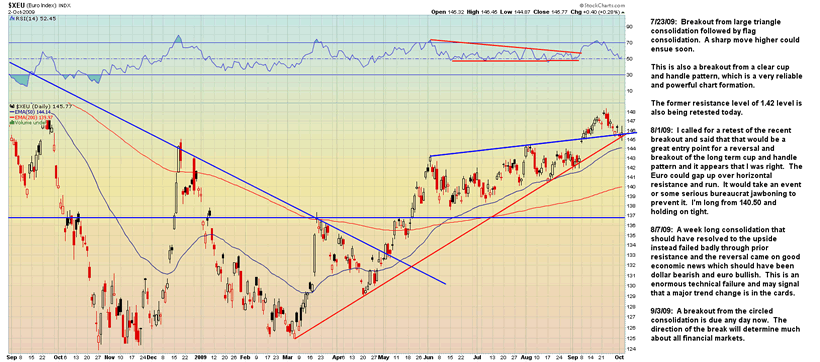
The Euro tested its uptrend from the March bottom and bounced. Note that it appears to have emulated the SPX with a "throw over" upside break of a rising wedge formation which may leave behind a bull trap if its trend is violated.
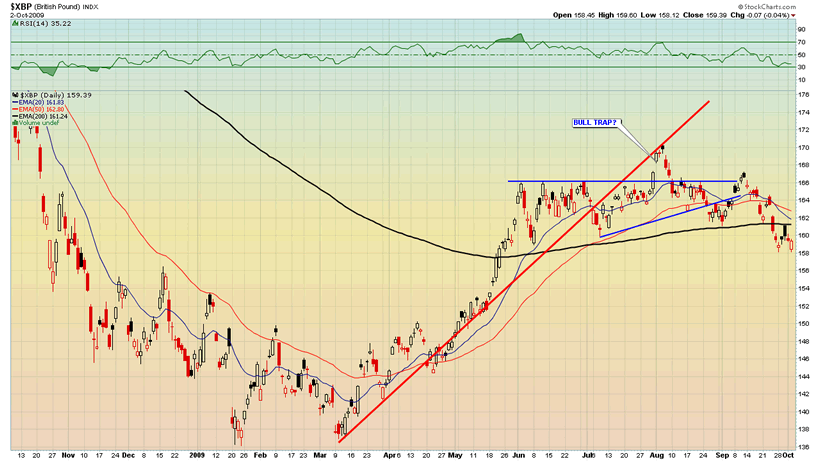
Is the British Pound leading the rest of the currencies down against the Dollar? The recent failed test of the 200 EMA is quite bearish.
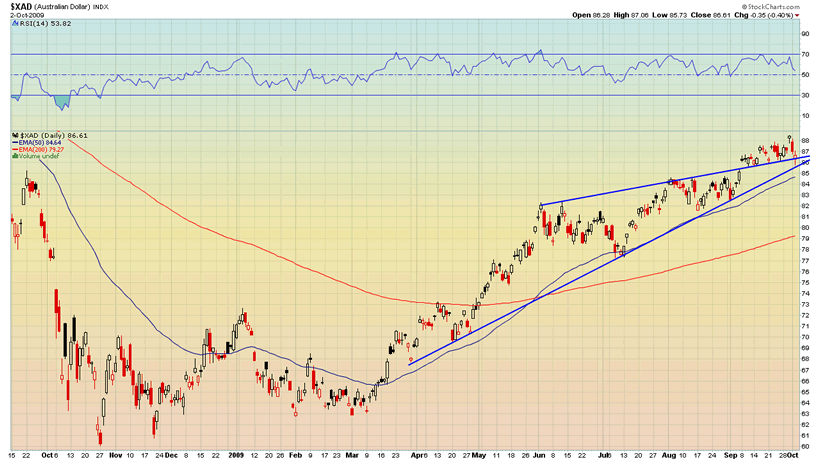
The Austrailan dollar has also produced a "throw over" break of an ascending wedge and is threatening its uptrend.
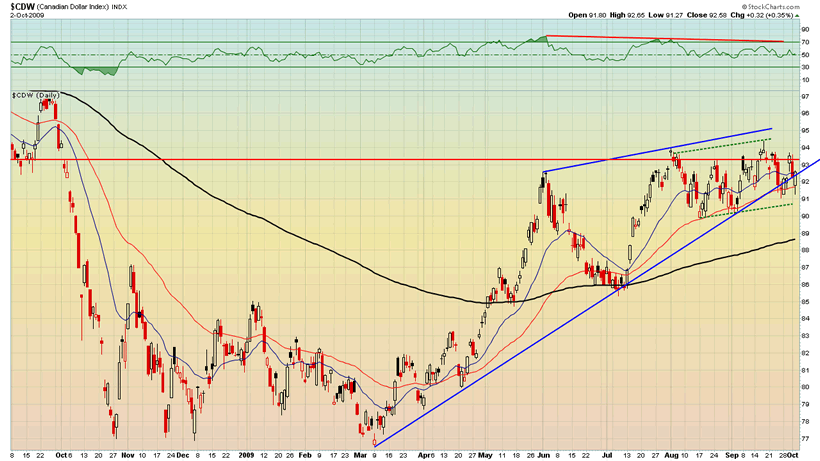
The Canadian Dollar has broken trend and is now retesting the break.
If you benefitted from this installment of The BullBear Market Report please consider making a DONATION.
Subscribe to my free BullBear Trading Service to get all the details of my trades as they develop.
The BullBear Market Report is live every Monday and Thursday after the closing bell. Call in with your questions, thoughts and observations.
Disclosure: No current positions.
By Steve Vincent
The BullBear is the social network for market traders and investors. Here you will find a wide range of tools to discuss, debate, blog, post, chat and otherwise communicate with others who share your interest in the markets.
© 2009 Copyright Steven Vincent - All Rights Reserved Disclaimer: The above is a matter of opinion provided for general information purposes only and is not intended as investment advice. Information and analysis above are derived from sources and utilising methods believed to be reliable, but we cannot accept responsibility for any losses you may incur as a result of this analysis. Individuals should consult with their personal financial advisors.
© 2005-2022 http://www.MarketOracle.co.uk - The Market Oracle is a FREE Daily Financial Markets Analysis & Forecasting online publication.