Gold Off The Launching Pad
Commodities / Gold & Silver 2009 Oct 05, 2009 - 03:11 PM GMTBy: Guy_Lerner
 Back on April 30, 2009, when gold was trading at $895 per ounce, I wrote an article suggesting that gold was on the appropriate launching pad for a sustainable move. At that time, I did not clarify what direction that move would be. Honestly, I did not know. I did know that gold had been consolidating in a range (which I could quantify), and similar consolidations in gold usually led to a breakout in either direction.
In that article, I wrote the following:
"What we do know is this: compressed prices can lead to explosive moves in either direction.
What we don't know is this: what direction that it will ultimately be.
So this period of consolidation in gold (and most other assets) meets my criteria for a set up that can act as a launching pad for higher prices. But it can also be a launching pad for lower prices, too.
To my credit I did write the following about gold on April 30: "I wish I had an answer, but any technical indicator that I have for you would only be curve fitting in my opinion. But all is not lost as the current set up offers a low risk entry for going long gold."
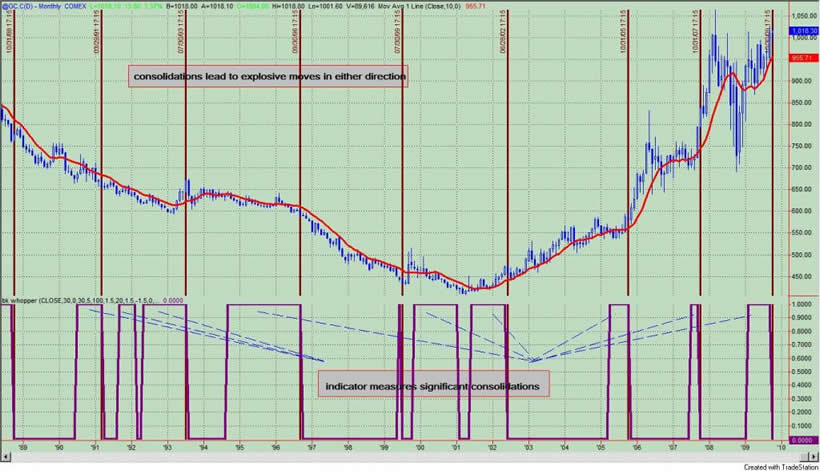
See figure 1, a monthly chart of a continuous gold contract. Our indicator, which measures the degree of consolidation, is shown in the lower panel. Gold prices have been compressed to a statistically significant degree for the last 8 months. It appears that September's upside resolution or "breakout" will result in higher gold prices as volatility increases and the range is broken. Gold is officially off the launching pad!!
Figure 1. Gold/ monthly

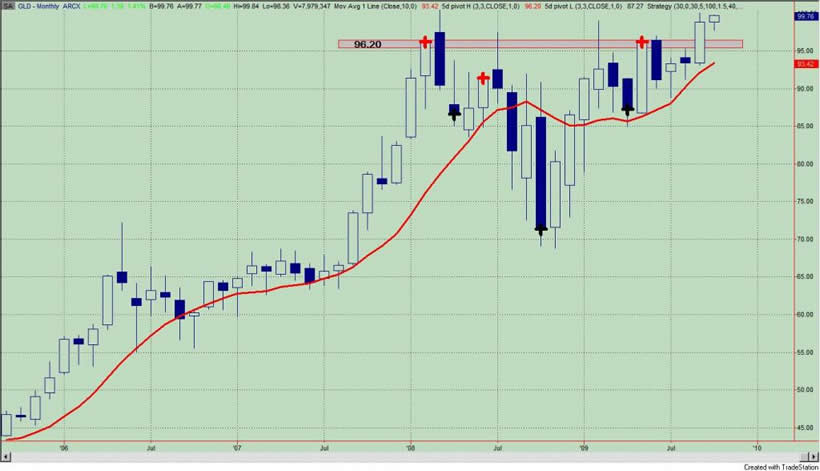
Technically, the "breakout" as per my definition would be a close over two pivot high points, and this is what we have. I cannot be any clearer. See figure 2, a monthly chart of the SPDR Gold Trust (symbol: GLD). The pivot high point at 96.20 is now support. A monthly close below this level is reason to abandon the notion of higher gold prices.
Figure 2. GLD/ monthly

While I normally don't predict how far prices will go, we can do a price projection for GLD based upon the chart pattern. The width of the base is about 25 GLD points; we can add this to the breakout point of 96.20 and we get a price projection of 121 on the GLD.
Lastly, I will pose the following and attempt to answer in a future commentary: Why is gold breaking out? What is the significance?
By Guy Lerner
http://thetechnicaltakedotcom.blogspot.com/
Guy M. Lerner, MD is the founder of ARL Advisers, LLC and managing partner of ARL Investment Partners, L.P. Dr. Lerner utilizes a research driven approach to determine those factors which lead to sustainable moves in the markets. He has developed many proprietary tools and trading models in his quest to outperform. Over the past four years, Lerner has shared his innovative approach with the readers of RealMoney.com and TheStreet.com as a featured columnist. He has been a regular guest on the Money Man Radio Show, DEX-TV, routinely published in the some of the most widely-read financial publications and has been a marquee speaker at financial seminars around the world.
© 2009 Copyright Guy Lerner - All Rights Reserved
Disclaimer: The above is a matter of opinion provided for general information purposes only and is not intended as investment advice. Information and analysis above are derived from sources and utilising methods believed to be reliable, but we cannot accept responsibility for any losses you may incur as a result of this analysis. Individuals should consult with their personal financial advisors.
Guy Lerner Archive |
© 2005-2022 http://www.MarketOracle.co.uk - The Market Oracle is a FREE Daily Financial Markets Analysis & Forecasting online publication.


