Gold Breakout and Dollar Breakdown Signaling Big Political Crisis Brewing
Commodities / Gold & Silver 2009 Oct 06, 2009 - 06:20 AM GMTBy: Brian_Bloom
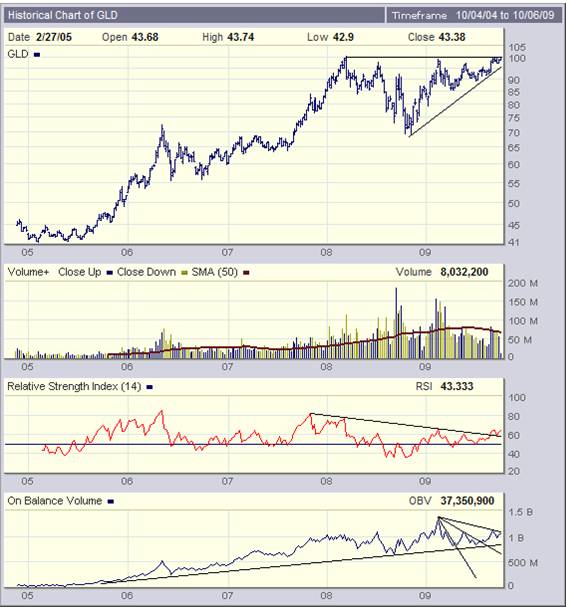
 As the price of GLD (a proxy for gold) is approaching the apex of a triangle, there “must” be a resolution of the direction in the next few days. (Chart courtesy Bigcharts.com)

Based on commitment of traders position, theory says the gold price should break down from here.
Further, the OBV chart above is showing a fan formation which – if it does not break up – should cause GLD to break down strongly.
Maddeningly, the signals on not clear. A fan formation is often bullish. If the OBV chart breaks up from the three line fan formation, the price of GLD may run up.
There are three straws in the wind that argue that GLD should break up and run for at least a 30% rise:
- The RSI in the above chart gave a buy signal a couple of days ago
- In the price chart above, within the rising right angled triangle pattern (typically bullish) there is also an inverted Head and Shoulders pattern (also bullish?) – and volume has been rising into the completion of the second shoulder. Rising prices accompanied by rising volume is typically bullish. Having said all this, the signs are subtle rather than obvious.
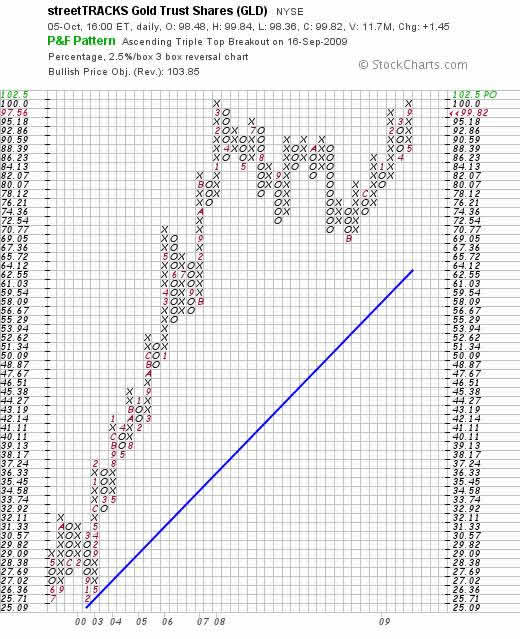
- The 2.5% X 3 box reversal P&F chart below gave a buy signal two weeks ago (Chart courtesy Stockcharts.com)

Its nail biting time. The Goldollar Index in the chart below (courtesy Decisionpoint.com) looks like it has already given a “tentative” buy signal following a break up from a three line fan formation (blue dashed lines). However, it is still moving within the confines of a “diamond” formation (red lines) – which, theory says, could be either a consolidation pattern or a reversal pattern.

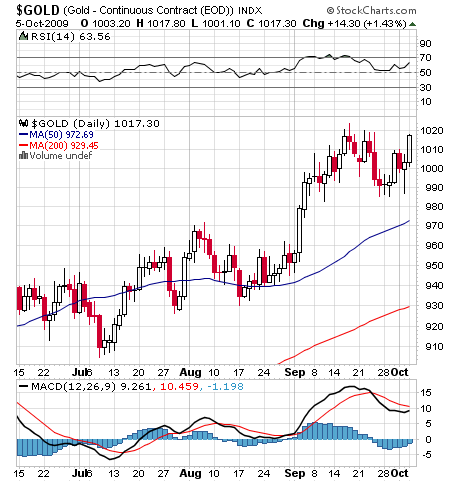
My view – flowing from the pattern on the histograms of the MACD chart below (courtesy stockcharts.com) is that the probabilities favor a break up.

Interestingly, if the Gold price does give a buy signal and this causes the Goldollar Index to give a buy signal, then this will not necessarily flow from a weakness in the US$.
Read together, the charts are telling me that there may be a political problem brewing somewhere.
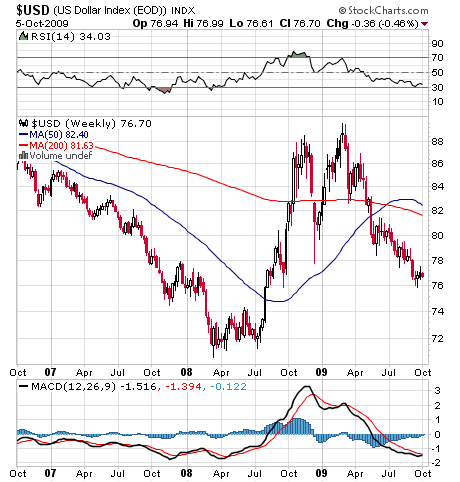
Have a look at the position of the MACD on the weekly chart of the US$ below. The histograms have been rising and the black MA line looks like it wants to cross above the red MA line. This is counterintuitive. Why would the US$ break up? Fundamentally, as many analysts have been arguing, the dollar is more likely to break down than up. Why would the technicals be strengthening?

Of course, if the US$ breaks up, it’s always possible that the gold price could give a sell signal. It might all just be technical in nature.
If it is technical in nature then this might cause the goldollar index to break down if the gold price cracks. (Possible, given the diamond)
Strictly speaking, we can’t make the call until after the breakout. But something about these charts doesn’t “feel” right to me. The gold price doesn’t feel weak. Why would both the gold price and the dollar be strong?
On balance, the charts - when read together – may be signaling that something unexpected is brewing.
It’s almost as if there are a few players out there who are expecting something to emerge out of left field that could change the nature of the game. If I was in a position of political power and I wanted to divert attention away from a potential financial crisis (as anticipated in my previous two articles), now would be the time I would act. I remember very clearly how, many years ago – when Ronald Reagan was in the White House and the markets were looking very vulnerable – just as they looked like they were going to collapse he announced the MX Missile and the Star Wars program – and the game changed overnight.
Conclusion
I don’t like the feel of this. The hairs on the back of neck are standing up. There may be a crisis brewing, and there are tentative signs that it may not be economic in nature.
Brian Bloom
Beyond Neanderthal is a novel with a light hearted and entertaining fictional storyline; and with carefully researched, fact based themes. In Chapter 1 (written over a year ago) the current financial turmoil is anticipated. The rest of the 430 page novel focuses on the probable causes of this turmoil and what we might do to dig ourselves out of the quagmire we now find ourselves in. The core issue is “energy”, and the story leads the reader step-by-step on one possible path which might point a way forward. Gold plays a pivotal role in our future – not as a currency, but as a commodity with unique physical characteristics that can be harnessed to humanity's benefit. Until the current market collapse, there would have been many who questioned the validity of the arguments in Beyond Neanderthal. Now the evidence is too stark to ignore. This is a book that needs to be read by large numbers of people to make a difference. It can be ordered over the internet via www.beyondneanderthal.com
Copyright © 2009 Brian Bloom - All Rights Reserved
Disclaimer: The above is a matter of opinion provided for general information purposes only and is not intended as investment advice. Information and analysis above are derived from sources and utilising methods believed to be reliable, but we cannot accept responsibility for any losses you may incur as a result of this analysis. Individuals should consult with their personal financial advisors.
Brian Bloom Archive |
© 2005-2022 http://www.MarketOracle.co.uk - The Market Oracle is a FREE Daily Financial Markets Analysis & Forecasting online publication.
Comments
|
KG
08 Oct 09, 14:34 |
bull / bear
I get the same feeling. The bull v bear chatter has slowed to a strange silence of confusion. Something is ready to go. |


