Gold and Silver Analysis - The Beauty of Bernanke's Machine
Commodities / Gold & Silver Jun 30, 2007 - 02:08 PM GMTBy: Joe_Nicholson
 The metals can't be held down forever, but that doesn't mean that there isn't one last blast up the sleeves of their opponents, that even from here or hereabouts there couldn't be another selloff like we saw last September… If the Fed acknowledges … the weaker inflation data this could keep their overall posture in balance and signal a return to the prosperity enjoyed by all markets over the last twelve months. For a while. ~ Precious Points , June 24, 2007

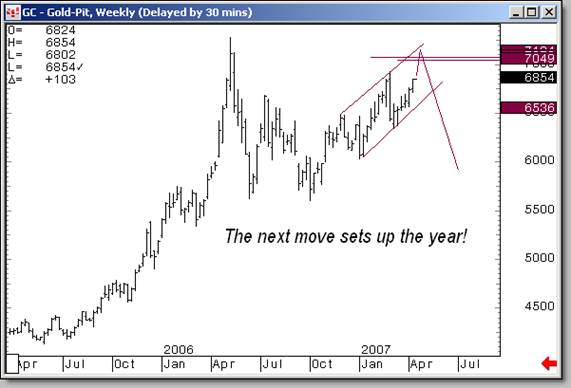
(chart by Dominick)
Readers may remember the chart above, which was originally published back in April when most metals analysts were predicting a breakout in metals. To be fair, the chart includes a level that would confirm a breakout, but it clearly anticipates a failure at or near the $700 level, which was realized perfectly. Previous updates tell the story of why taking out the 2006 became increasingly unlikely. The most recent updates describe the descent.
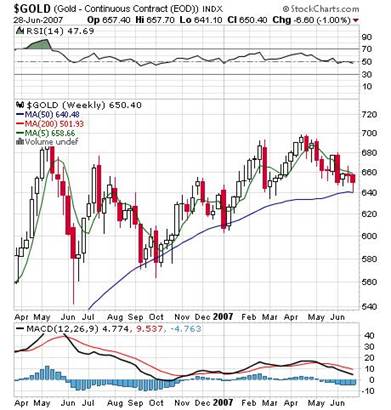
Having now reached the lower limit of the channel, it's one thing to say the longterm outlook is still bullish; this update, however, has worked for readers by outlining opportune buying moments and focusing on key technical levels. For gold, those levels were the 5-week and 50-week simple moving averages. As the chart below shows, gold vibrated between those two exact levels perfectly last week, staging an impressive bounce off the lows.

(chart by Dominick)
And, while this doesn't necessarily mean the “bottom” is in for gold, it does highlight an important support level and a relatively low risk buying opportunity. Notice that previous tests of the 50-week moving average have preceded significant rallies over the past year. Two consecutive weekly closes above the 5-week moving average constitute “confirmation” of a new upleg in the gold bull market. Members at TTC know our next support levels if the 50 is taken out.
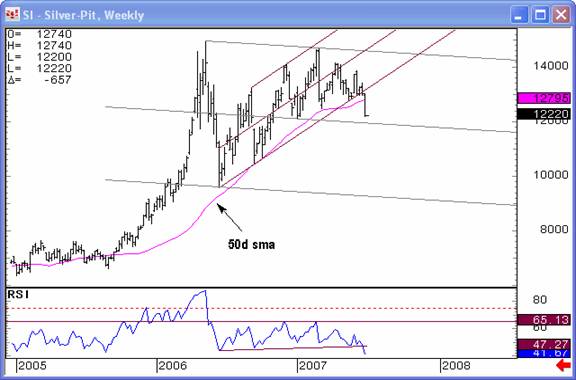
The corresponding level in silver was the 50-day simple moving average. Because of it's relative illiquidity, silver tends to exaggerate the trends in gold and occasionally offers a lead. The chart below shows silver violently breaking below support at an intermediate term trendline and the 50-day moving average. While this does not mean the bull market in silver is over, it emphasizes the ongoing corrective pattern from the 2006 high and suggests a possible move to the gently downward-sloping trend channels depicted below. Though the 50-day moving average will now act as resistance, a tentative buying level is beginning to be described.

(chart by Dominick)
As expected, Thursday's Fed statement acknowledged the recent cooling in inflation data, and this was actually bullish for metals and confirmed statements in recent updates to that effect. End of the quarter volatility aside, last week again demonstrated the elegance and, for lack of a better term, beauty of the Bernanke Fed and it‘s bullish implications for precious metals, the two most important elements being the interest rate targeting regime, and the inflation targeting aspiration.
The first part, an interest rate targeting regime, simply means that the Federal Reserve conducts its open market activities so as to maintain an overnight lending rate at or about a fixed level, currently 5.25%. In previous decades, the Fed targeted money supply growth and let interest rates float. Under Bernanke, the exact opposite occurs: money supply is allowed to float as the Fed funds rate remains steady. Increases in the demand for money require the injection of new money to maintain the target rate. Conversely, with the economic slowdown in the first quarter of this year, the rate of increase in M2 slowed to about 6%. This is how the Fed was able to accurately predict twelve months ago that inflation would decline as GDP growth slowed, even though traditionally the opposite relationship held true.
The second point to understand about the Fed's policy is its desire to institute an inflation targeting regime. This simply means the Fed knows any increase in the demand for money will result in an expansion of the monetary base, and that this logically suggests using an acceptable inflation range as the signal to either lower or raise the target rate. There's a wide variety of inflation measures and, similar to the Treasury's view on bond yields, the Fed continually seeks ways to understate inflation and thereby limit the cost to the U.S. government of inflation-indexed obligations such as Social Security payments and employee pay-packages. Still, the very important role of inflation in monetary policy makes it a legitimate concern, in fact the “predominant policy concern” as the Fed has repeatedly affirmed, and this focus keeps precious metals on traders' minds. Now, that's a beautiful thing!
The real elegance of the system, though, is that it is to a large degree self-regulating. Hence the now year-long freeze at 5.25%. As housing and the consumer drag down GDP, the Fed's steady rate target allows it to slow the growth of M2 and limit the spread of inflation. The specter of collapse, the Fed's supposed “dilemma” has actually helped by keeping yields artificially low.
All things remaining equal, though, the target rate will have to rise as other central banks continue to raise their rates and as global GDP growth and other factors place upward pressure on commodity prices. This is the “high level of resource utilization” that seems to be the extent to which the Fed wishes to address headline inflation. Low inflation became good medicine for the metals when it stymied a rapid shift in bond yields. Over the long term, it's always bullish for metals because it depreciates paper assets, and if the U.S. economy recovers, the need for new money will offset the rise in yields.
Which makes it good news for longterm precious metals investors that the Fed's concern over the future of inflation appears to be justified! In particular, the increase in oil and agricultural commodities represent two of the greatest inflation pressures that threaten the convincing demonstration of moderating inflation. The forward-looking statements of a variety of companies suggest that rises in material and production costs can no longer be absorbed and will be increasingly passed on to consumers. Even core inflation measures can be effected as increases in food and energy costs create self-fulfilling inflation expectations and wage pressures.
The bottom line is that the Fed's monetary policy, which allows for vast expansion of the monetary base, once again came to the rescue of the precious metals this week. This doesn't mean that metals have bottomed, particularly with another rate hike from Japan possibly looming later this year, but it is a positive sign. Even with further downside exploration highly likely in the volatile months to come, short term money can and is being made by members at TTC.
If you're reading this update before July 1, this is your VERY LAST CHANCE to join before rates increase to $89/month, still a fraction of the profit-making potential of the site. Members already have access to the proprietary gold trend cycle charts which suggest the direction and extent of the next move. To get access, join now .
by Joe Nicholson (oroborean)
This update is provided as general information and is not an investment recommendation. TTC accepts no liability whatsoever for any losses resulting from action taken based on the contents of its charts,, commentaries, or price data. Securities and commodities markets involve inherent risk and not all positions are suitable for each individual. Check with your licensed financial advisor or broker prior to taking any action.
Joe Nicholson Archive |
© 2005-2022 http://www.MarketOracle.co.uk - The Market Oracle is a FREE Daily Financial Markets Analysis & Forecasting online publication.


