


Stock Market Crash, Banking on a Repeat of 2008
Stock-Markets / Financial Crash Oct 14, 2009 - 07:49 AM GMTBy: Garry_Abeshouse

 It’s happened before, it can happen again. -
In mid 2008 I accurately predicted the collapse of major US and European bank stocks, based in part on the analysis of my long term hand drawn Point & Figure charts. These same charts are now indicating a bull trap in the making and a probable return of the bear some time over the next six months. The V-shaped patterns on the higher performing banks together with the predominance of upward wedge patterns throughout the broader US market also indicate that we are entering an extremely high risk time even now.
It’s happened before, it can happen again. -
In mid 2008 I accurately predicted the collapse of major US and European bank stocks, based in part on the analysis of my long term hand drawn Point & Figure charts. These same charts are now indicating a bull trap in the making and a probable return of the bear some time over the next six months. The V-shaped patterns on the higher performing banks together with the predominance of upward wedge patterns throughout the broader US market also indicate that we are entering an extremely high risk time even now.
At the moment, one possible scenario (of many) could be a bank related fall in equity markets, triggering a secondary derivative related sell off in the mid to latter stages of the move down.
A question for the bulls:
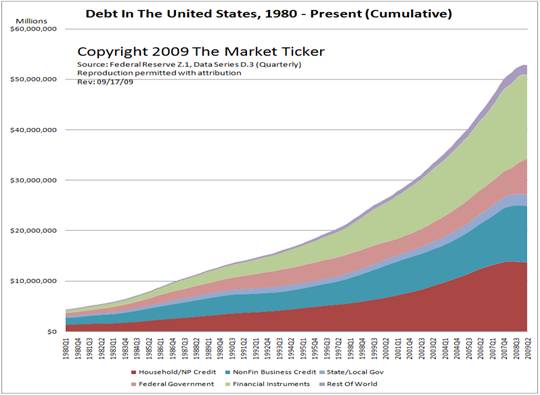
How can you have a new bull market when the debt levels are the same as what they were twelve months ago?
Another question for the bulls:
How can you have a new bull market when recent reports on derivative trading from Fitch, Bank of international Settlements and the US Treasury have all criticized five of the seven banks below for not fully divulging the extent of their exposure to derivative trading?.
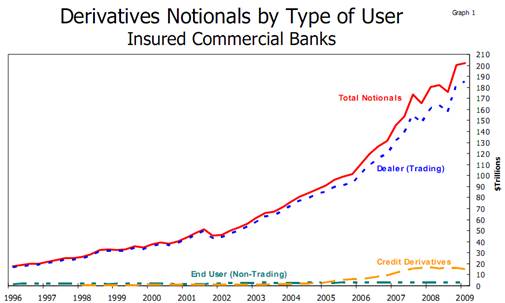
The graph below shows how the growth in traded derivatives has increased exponentially since 2002 – a mere eight years. Note that due to disclosure differences the total notional derivative figure shown on the graph below is actually US$202 trillion – substantially less than the BIS disclosed global estimates of US$592 trillion at an average gearing ratio of over 16:1 and also much lower than the more recent US Treasury figure. And these figures obviously do not include off balance sheet totals. Who ever heard of a bull market actually starting with these sort of debt and gearing levels.
The US Department of Treasury’s Quarterly Report on Bank Trading and Derivatives Activities First Quarter 2009, noted that:
“Derivatives activity in the U.S. banking system is dominated by a small group of large financial institutions. Five large commercial banks represent 96% of the total industry notional amount and 83% of industry net current credit exposure.”
(see discussion of this report here as well as Appendix 1 at the end)
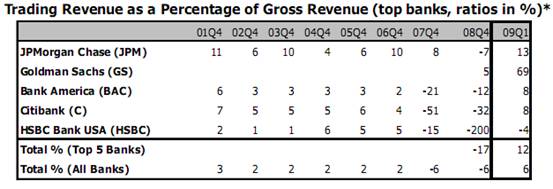
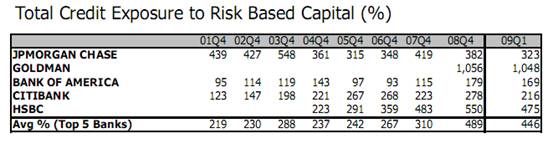
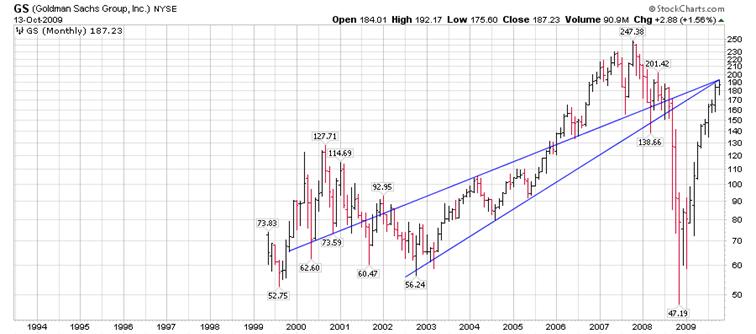
The report also showed that 69% of Goldman Sach's income now comes from trading revenue, while at the same time having the highest credit exposure to risk base capital ratio of 1048:1
Could the failure of the major US bank indexes to make new highs after the first week of August, 2009 be a sign that this bear market rally is coming to an end? Surely this recent article from Bloomberg should be a very loud wake up call that not all is OK with the US financial world.
(Extracts only)
Oct 1st 2009 (Bloomberg) -- Banks Have Us Flying Blind on Depth of Losses
“There was a stunning omission from the government’s latest list of “problem” banks, which ran to 416 lenders, a 15-year high, as of June 30. One outfit not on the list was Georgian Bank, the second-largest Atlanta-based bank, which supposedly had plenty of capital.
It failed last week.
Georgian’s clean-up will be unusually costly. The book value of Georgian’s assets was $2 billion as of July 24, about the same as the bank’s deposit liabilities, according to a Federal Deposit Insurance Corp. press release. The FDIC estimates the collapse will cost its insurance fund $892 million, or 45 percent of the bank’s assets. That percentage was almost double the average for this year’s 95 U.S. bank failures, and it was the highest among the 10 largest ones.
How many other seemingly healthy multibillion-dollar community banks are out there waiting to implode? That’s impossible to know, which is what’s so unsettling about Georgian’s sudden downfall. Just when the conventional wisdom suggests the banking crisis might be under control, along comes a reality check that tells us we’re still flying blind.
The cost of Georgian’s failure confirms that the bank’s asset values were too optimistic. It also helps explain why the FDIC, led by Chairman Sheila Bair, is resorting to extraordinary measures to replenish its battered insurance fund.”
“What wasn’t made public until Sept. 25, the day it closed, was that Georgian Bank had agreed to a cease-and-desist order with the FDIC on Aug. 31 after flunking an agency examination. The 19-page order described various “unsafe or unsound banking practices and violations of law and/or regulations,” including failing to record loan losses in a timely manner. Georgian neither admitted nor denied the allegations.
The FDIC updates the public about the number of banks on its problem list once a quarter. An FDIC spokesman, David Barr, said Georgian was added to the FDIC’s internal list in July. He said the agency adds banks to the list based on exam ratings, not the data in their financial reports.
As for the 416 banks on the list as of June 30, up from 305 a quarter earlier, the FDIC said their combined assets were $299.8 billion. (The FDIC didn’t name the banks, per its usual practice.) If Georgian’s experience is any guide, the real-world value of those assets probably is much less.”
US Finance and Bank Stocks fail to follow Composite Indexes up in September and October.
A survey of daily price charts of seventy four (74) Banks, Finance and Insurance companies taken from the Global Fortune 500 list shows that 64%, almost two thirds, failed to follow the main US composite indexes to new market highs. The Finance sector indexes shown in this posting illustrate this lack of follow through very clearly. See yesterdays posting here for my discussion on the British Pound.
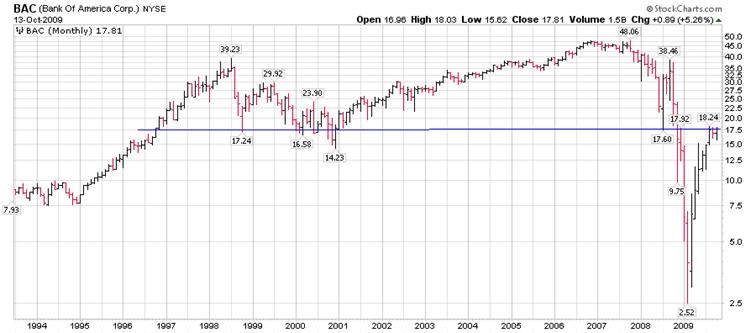
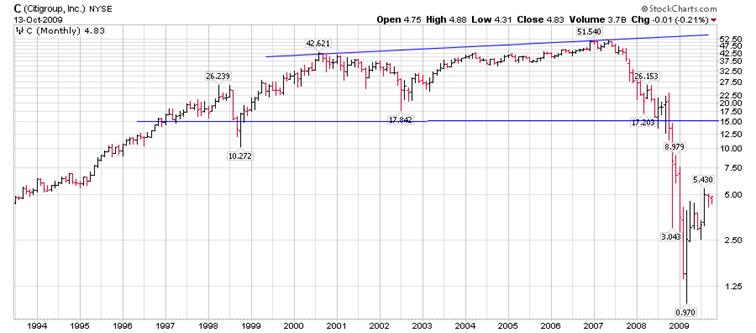
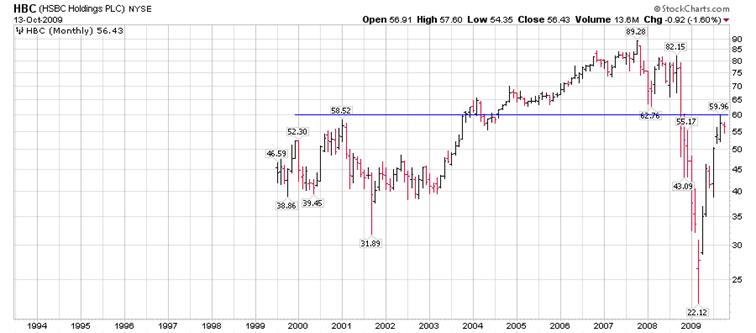
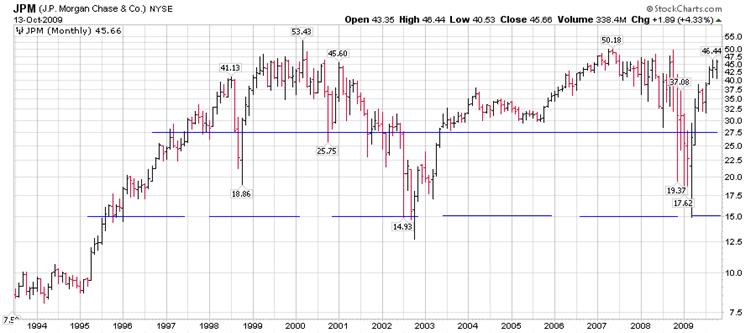
I consider the seven major banks shown below to be highly vulnerable at current prices.
The charts of these “Big Seven” major banks collectively tell an interesting story. All broke down from tops ranging up to 11 years.
All have pulled back to various degrees, with the stand out one being JP Morgan Chase which is testing its 2008 highs. Goldman Sachs is not far behind.
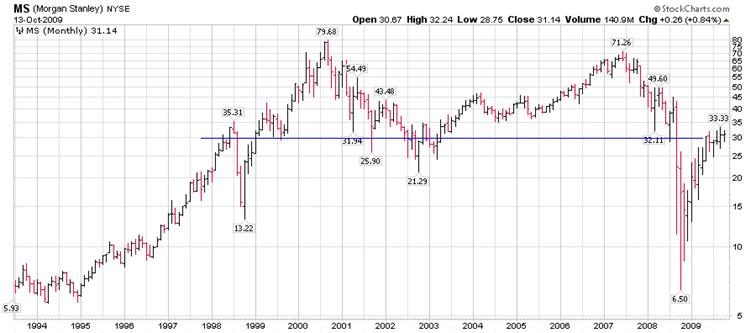
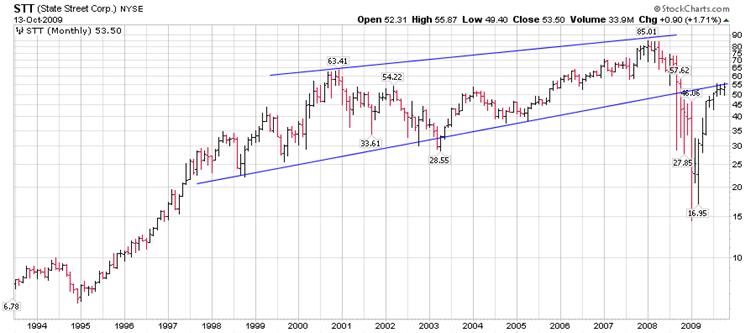
Bank of America, HSBC, Morgan Stanley and State Street (more of a wedge) have all pulled back to their necklines. No comment on Citigroup.
Given that we are probably at the top of an extended bear market rally, what these banks have in common is very little upside potential, while being susceptible to steep falls in any general market weakness. Perhaps the extracts above from Bloomberg should give some food for thought.
Till next time.
Garry Abeshouse
Technical Analyst.
Sydney
Australia
I have been practicing Technical Analysis since 1969, learning the hard way during the Australian Mining Boom. I was Head Chartist with Bain & Co, (now Deutsch Bank)in the mid 1970's and am now working freelance. I am currently writing a series of articles for the international "Your Trading Edge" magazine entitled "Market Cycles and Technical Analysis".
I have always specialised in medium to long term market strategies and after discovering the excellent Point & Figure Charts from Stockcharts.com in mid 2008, have concentrated on this style of charting ever since.
© 2005-2022 http://www.MarketOracle.co.uk - The Market Oracle is a FREE Daily Financial Markets Analysis & Forecasting online publication.