


Weekly Gold and Silver Technical Analysis Report -1st July 2007 - Technically Precious with Merv
Commodities / Gold & Silver Jul 01, 2007 - 02:59 PM GMTBy: Merv_Burak

Despite a small up tick near the week-end gold is still tracing a slow and steady downward slope. Will it accelerate or come to an end? --- Only THE SHADOW KNOWS (real old timers will remember).
The U.S. Dollar Index
A year or two back I used to review the US $ occasionally, and especially with the P&F chart. I was asked recently why I no longer do so. I had decided to concentrate on gold and silver and so the US $ reviews were just set aside. For old times sake here is the latest P&F of the US $ Index and a brief summary where it's at. The chart and summary are both from a longer term stand point.
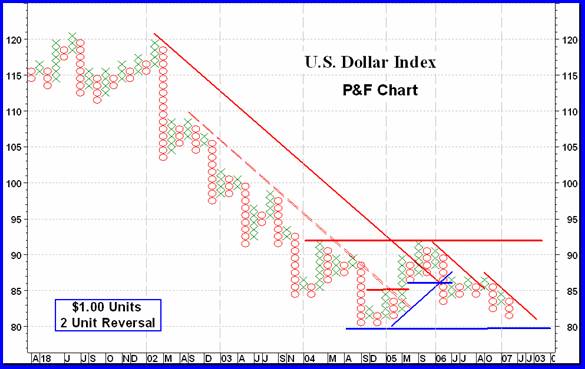
As we see, from the double top in early 2002 to the bottom in 2004 it had been a steady decline, in steps. After the initial severe plunge in 2002 the steps were able to provide us with a second trend line below the primary 45 degree trend line. This second trend line was broken in 2005 and along with a move above 2 previous X 's gave us a bull signal with a price projection to 93. The move halted 40 cents short of the projection BUT at the level of the previous rally in early 2004. Since then it has been down hill again with a bear signal given on the breaking of the up trend line and a move below two previous O 's. This gave us a projection back to the 80 level, or more appropriately, the previous support at 81. The $ Index came within 10 cents of the 81 level before going into a short rally over the past few weeks. It looks like it may be heading back towards the support again.
Over a period of more than 20 years the $ Index had dropped to just above the 80 level on four occasions and then went into significant rallies or bull markets. On one extra occasion it did drop below the 80 level, but for only two weeks before turning around. The odds are that the $ Index will stay above the 81 level on the P&F chart (or just above the 80 level on a bar chart). Significant rally or a new bull market may be expected from there. Should it drop below the 80 level with any strength and for more than a few weeks, I guess the caution should then be “look out below”.
How this $ action relates to gold is difficult to assess. An opposite movement seemed to be in effect from 2002 to 2004 but since then the relationship has become somewhat murky.
GOLD : LONG TERM
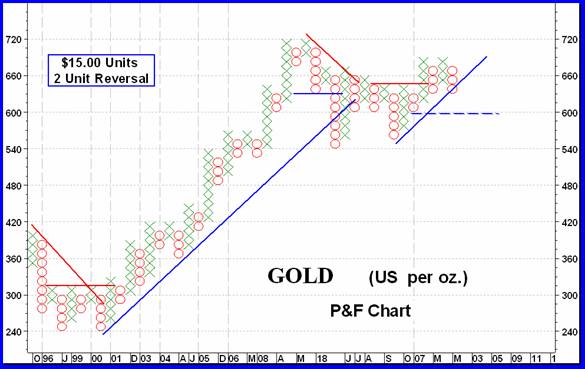
Looking at a long term P&F chart of gold one almost can see a direct upside down picture of the US$ Index chart. We have a double bottom. We have a long bull in step by step moves. We have an established resistance and a reaction. We are now in a new rally mode on the P&F but in a reaction mode on a shorter term basis. The only problem with this opposite chart pattern scenario is the TIME. There is almost a two year time difference between the $ bottom versus the gold top. So, for almost two years both have been moving in sync. They seem to be once more working in opposite directions but that two year period is a concern. It tells us that the general impression that the two move in opposite directions could be very wrong at times.
However, for now the two are working in opposite directions and while the US $ Index is in a bearish mode gold is still in a bullish mode, from the long term P&F chart.
As for the usual indicators, gold is below its long term moving average line with the line still very slightly pointing upwards. Momentum is still in its positive zone but continues to toy with its lowest level in years. It's not quite there yet but very, very close. As for the volume indicator, it continues to move lower below its negative trigger line. Putting it all together, the indicators are very weak but not quite yet at the bear level. I think I will move over into the NEUTRAL level this week in anticipation of more negative numbers ahead.
INTERMEDIATE TERM
Since last week's P&F chart the only change has been in the direction of the plot to the down side and with the O 's making new lows in the process. The trend is still bearish with the projection still to the $605 level. As for the normal indicators, well there's not much change there either. The trading action continues below a negatively sloping moving average line while momentum continues to move lower below its neutral line. The volume indicator is in sync with the others and is negative below its negatively sloping trigger line. Nothing changed here. I continue to be BEARISH from the intermediate term stand point.
SHORT TERM
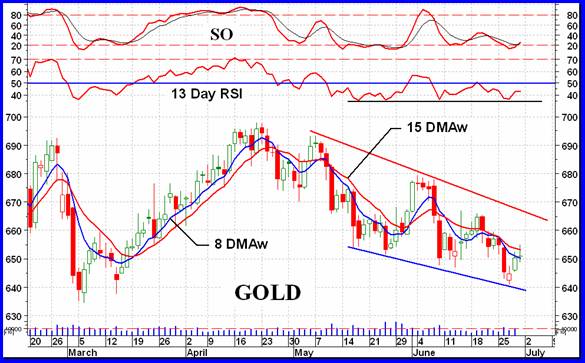
The short term continues to be under the influence of a down trend. Although toying with the moving average line (15 DMAw) gold still closed below its short term moving average and the line is still pointing lower. The momentum continues to move laterally below its neutral line. About the only sign of encouragement is the momentum. Over the past several weeks as the price of gold was making lower lows the momentum was not. The lows in gold were not made on increasing negative strength but on static strength. How much this may help towards a possible turn around remains to be seen. For now, go with the trend and that is still towards the down side. A close at or above $660 may be the turning point.
IMMEDIATE TERM
In this age of volatile world politics one cannot make a realistic analysis as to what is expected to transpire without a great deal of risk. That's why I use my trusty coin flip method. AND it's tails this week suggesting the most likely direction for gold in the next day or two is lower. That might be in contrast with the direction of the recent action. We have had three positive days in the market. Wednesday was a positive day even though it did close lower than the previous day. The open red body of the daily candle says that it CLOSED lower than the previous day BUT it also closed higher than the opening daily price. It therefore was a positive day be closing higher than where it started the day at. Friday was actually a stand still day with the close being at the same level as the open price. This may be what the coin flip is telling us, the rally may be over and we may be back to the down side on Monday.
North American Gold Indices
Well, it's once more the S&P/TSX Global Gold Index that gets reviewed. And the picture does not look good. It's been a steady down trend for the past several weeks. It's due for a rally, but who knows. It could continue down for a few more weeks.
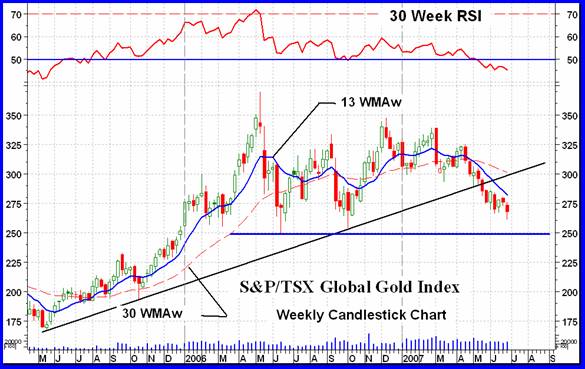
What we have is what looks like a huge topping activity with the Index presently in the roll-over period. It's rolling over and ready to plunge through the last support. Once through 250 then the next significant support would be the May 2005 low at 175. Unlike the Merv's Indices, the S&P/TSX Index has a long term moving average line that is very pronounced in the negative direction and a long term momentum that is well below its neutral line. The chart has this Index rated as a BEAR, confirming the table ratings. The Merv's Indices are not yet there from the chart ratings although the table is already bearish for them also.
MERV'S PRECIOUS METALS INDICES
Holiday weekend so I'll keep this section short.
It was a bad week all around for the precious metals. The 5 major Indices dropped by an average of about 2.1% while the Merv's Indices dropped by an average of about 1.5%. The Composite Index of Precious Metals Indices is now at a new low for this latest reaction from a double top. Both moving average, intermediate and long term, are sloping downward and only the long term momentum is very slightly in its positive zone. All in all I would rate the overall Composite market as BEARISH on the long and intermediate term.
MERV'S GOLD & SILVER 160 INDEX
The average loss of the 160 universe stocks was 1.5%. Unlike the Composite, the universe has not yet made a new low for this latest trend, but it's not far away. There were 44 gainers (28%) and 110 losers (69%) for a good indication of which way most stocks were going. However, there were no stocks in my over speculation category of plus/minus 30% movers and not that many above the 10% level (+ or -). Things are looking grim but speculators are not yet in a panic mode. The summation of individual ratings moved slightly lower during the week with all three time periods well in the BEARISH camp.
From the chart, the intermediate term is negative all around while the long term is still slightly positive with the moving average slope still positive and momentum still slightly in the positive zone. I would rate, from the chats, the intermediate term as BEARISH and the long term as NEUTRAL.
MERV'S QUAL-GOLD INDEX : MERV'S SPEC-GOLD INDEX : MERV'S GAMB-GOLD INDEX
The three sector Indices had all the same decline within a 0.1%, i.e. a decline of 1.5%. Although down on the week all three have still not made a new low for this move, unlike the Composite. The declining stocks were about the same for each Index, at 75%, plus or minus 5% leaving little room for advancers.
From the charts the Qual & Spec Indices can be put in one section and the Gamb in another. The Qual and Spec-Gold Indices showed all negatives for the intermediate term and can be rated as BEARISH. On the long term the momentum indicators are still slightly positive but heading lower. The Indices are below their intermediate term moving averages with the slope being upward for the Qual and downward for the Spec. Despite the slight positives in some indicators I would rate both of these Indices as BEARISH on the long term.
The Gamb-Gold Index is still in a better position than the previous two. The intermediate term is similar to the other two and can be rated as BEARISH. It's in the long term where the Gamb-Gold still shines. The Index is still above its positive sloping moving average line and the momentum is still comfortably above its neutral line although the direction of the momentum is towards the down side. I would still rate the long term as BULLISH but it may not be so for long if the market continues to weaken.
SILVER
Silver continues to under perform gold and took a real dive on Tuesday. It closed 5.1% lower on the week while gold only closed lower by 0.9%. Despite the –N ratings in the table I would now rate silver as BEARISH for all three time periods, from the charts.
MERV'S QUAL-SILVER INDEX : MERV'S SPEC-SILVER INDEX
Both Indices closed lower on the week but the Spec-Silver Index was the one that took the biggest hit with a decline of 4.5%. 88% of the Spec stocks closed lower with 3 in the double digit losses to push the Index down.
From the charts both Indices are BEARISH on the intermediate term with all negative indicators. On the long term both Indices are below their moving average lines but both lines are still very slightly positive in slope. Both momentum indicators are still positive but moving lower. Both of the Indices can be rated as NEUTRAL long term, from the charts.
MERV'S PRECIOUS METALS INDICES TABLE
I guess I'll call it a week.
By Merv Burak, CMT
Hudson Aero/Systems Inc.
Technical Information Group
for Merv's Precious Metals Central
Web: www.themarkettraders.com
e-mail: merv@themarkettraders.com
During the day Merv practices his engineering profession as a Consulting Aerospace Engineer. Once the sun goes down and night descends upon the earth Merv dons his other hat as a Chartered Market Technician ( CMT ) and tries to decipher what's going on in the securities markets. As an underground surveyor in the gold mines of Canada 's Northwest Territories in his youth, Merv has a soft spot for the gold industry and has developed several Gold Indices reflecting different aspects of the industry. As a basically lazy individual Merv's driving focus is to KEEP IT SIMPLE .
To find out more about Merv's various Gold Indices and component stocks, please visit www.themarkettraders.com and click on Merv's Precious Metals Central . There you will find samples of the Indices and their component stocks plus other publications of interest to gold investors. While at the themarkettraders.com web site please take the time to check out the Energy Central site and the various Merv's Energy Tables for the most comprehensive survey of energy stocks on the internet. Before you invest, Always check your market timing with a Qualified Professional Market Technician
Merv Burak Archive |
© 2005-2022 http://www.MarketOracle.co.uk - The Market Oracle is a FREE Daily Financial Markets Analysis & Forecasting online publication.