Has Gold Confirmed Weekly Breakout?
Commodities / Gold & Silver 2009 Oct 21, 2009 - 01:33 AM GMTBy: Bill_Downey
 With the new highs we have seen in October, the time has arrived where gold is making an important decision in its medium and long term price direction. In other words it has arrived at a major inflection point when viewed on a weekly price chart. We’ve been tracking this medium term breakout scenario and this is a follow-up to some of the recent articles published.
Why Price charts?
We live in a world where a few months ago, there was a glut of oil. That was about 25 dollars per barrel ago lower. If we were using the same formula in unemployment claims as we did in the past, the current unemployment reading would be 16% in the USA. Just because they’ve changed the formula and tell us its only 10%, the reality is that it’s really 16%. Yet, the stock market will think nothing of tacking on 3400 points in 6 months. How about the CPI (consumer price inflation)? That indicator is the most useless thing we have to measure inflation. The ONLY DEFLATION that I see is if you own gold. Then yes, the price of everything is going lower.
It’s apparent to me that the information age, for the most part, is for the most part the disinformation age. So to try and get a real feel, we look at price charts because, well, because, price is reality. Price is the real scorecard. Everything we know or PERCEIVE to know is built into the price. Since we’re not sure what to believe anymore, our solace is the price chart.
The charts below are courtesy of www.stockcharts.com I have included a few technical indicators which I consider coincidental that I look at. What I mean by coincidental is while price action is what is most important, I’ll look at the technical indicators to see if they are acting the same way as the last gold bull market rally in 2007 to assist in confirming the price move. The more we see things the same as in 2007, the more confident we can be that a similar price advance is developing
At the bottom of the chart is a volume graph. I overlay the volume of the ETF stock GLD as my proxy so as to observe volume patterns. So far, we’ve seen a volume increase, albeit a huge spike would be nice on a major up week. During the initial moves in 2007, the volume gains were no more than the current increase, so we are ok here.
Above the volume graph we have a MAC-D histogram graph. Here too we are watching if the bar rise resembles the same as they did in 2007. We were concerned a few weeks ago because a weekly bar came in lower than the previous week. But the last two weeks each put a new higher bar and now this indicator is once again mirroring the 2007 timeframe. This indicator remains in bullish mode and acting as in 2007. (see Red circles at the MACD portion of the chart)
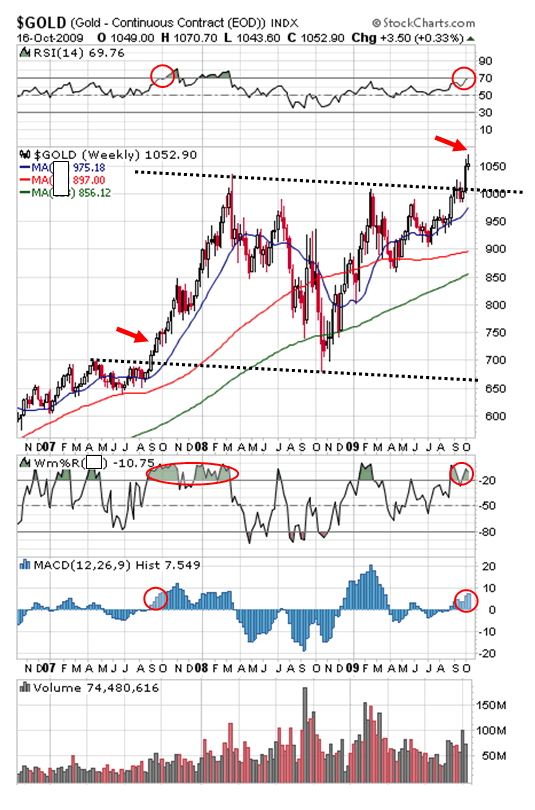
Above the MACD graph is an indicator called Williams%R. It’s an oscillator that measures overbought and oversold and thus attempts to pick turning points in trend. The oval circled portion of 2007 demonstrates that in REAL bull market impulsive bull leg price runs, this indicator can stay pegged in overbought condition throughout the rally. Not only that, but when it comes out of overbought mode, it’s usually a good signal that a potential price peak has been achieved. For now, the indicator is currently EXACTLY the same as it was during the 2007 bull leg rally. As long as it remains above 80, it will be mirroring the 2007 timeframe and odds will favor the rally continuing.
Finally at the very top of the chart we can see that RSI is now just below the 70 area.
We see in 2007 that RSI can move above 70 and remain there for a while. As long as the other indicators stay pegged, we think that RSI is acting no different than in 2007’s great bull market rally.
Observations: (a quick review)
Indicators stay overbought in bull market legs and trends only end or correct hard once they come out of bullish mode. As long as they are modeling 2007 and price is doing the same, we think the “ODDS” favor higher prices.
The chart pattern and breakout looks very similar to 2007.
Do we have a Breakout in gold? YES. We do. To better understand the position that Gold is in let us draw this parallel. From a visual perspective, the bar from last week on the weekly chart is akin to the space shuttle on its launching pad and there is no doubt that the countdown ended and liftoff occurred with the unemployment report a few weeks ago as gold moved up 75 dollars that week. So we have liftoff.
The upcoming few weeks can be paralleled to the shuttle’s key moment called “throttle up.” The throttle up command is where the space shuttle’s o-rings gave way during that horrific day it came crashing down to earth. In the same manner, gold is set up at the “make it or break it point” on the Medium Term timeframe in price. In other words, this is where gold is given the throttle up command. If things are to go wrong with this breakout, this is usually the most likely place it’s going to happen. This is where the o-rings can blow. As of this moment, we see no danger signals to this breakout.
What about a pullback? We could get one but it’s not a necessity. The rally of 2007 did not have one as the strongest rallies many times do not have a pullback until higher levels. A recent example of this was when gold broke above the 960 area in September when we achieved a daily breakout of price. It just never pulled back until it reached 1000 and when it did, it only pulled back a mere 15 dollars to 985.
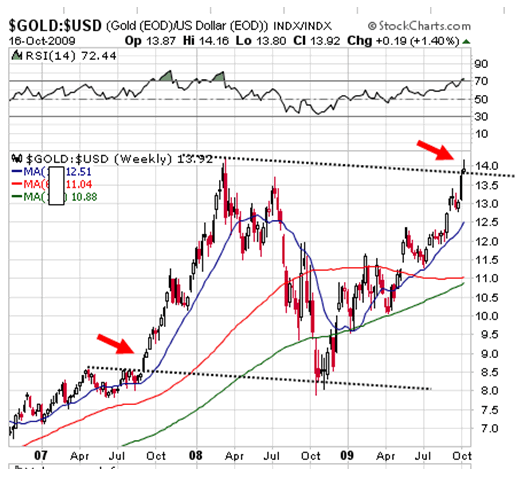
Let’s take a look at the dollar versus gold. In the chart below we see a very similar pattern as the gold chart with one important difference. The breakout thus far has only breached the upper dotted trend line and has NOT made a new high thus far. The reason is simply that while gold has made new highs, the dollar has not made new lows that parallel the March 2008 highs in gold. Another important consideration is that last weeks close was near pretty much at the lows of last week. As long as we remain above this upper dotted channel line, the dollar will weaken and gold will strengthen.
While there can be no doubt that the dollar is a currency that is in trouble, might there be just a little too much bearishness over the short term? It’s not that it isn’t justified, but at only 3% bulls, the theater is crowed with a lot of bears in the dollar camp. While this is not a sell signal in itself, it is suggestive that we need to keep a close watch just the same until we break higher in this chart as well. If this chart below were to make a move above the March highs in conjunction with gold closing above the 1080-1085 area, it would go a long way in confirming that the current rise in gold has still legs to go higher and the dollar selloff could continue lower.
.
From a seasonal standpoint the next 8 weeks are usually the dollars strongest time period of the year and of course, gold the weakest. However, when we really take a look around, it’s a one way market. Everything is going up……….except the dollar. Take a look at the Goldman Sacs Commodity index in October shown below. In 12 trading days it made up 60 days worth of loss. That is serious strength and of course dollar weakness.
What next?
The critical TIMEFRAME for gold in which a fall pullback usually occurs in the metals is the months of October and/or November. They have on average provided that time period for a fall low point many times in the past. But discerning exactly when the pullback will occur this year (as any other I guess) is proving difficult. We can only review and weigh the evidence and infer what the data suggest are the best “odds” for the timing point. Let us begin with October.
The last two weeks of October is USUALLY THE WORSE MONTH OF THE YEAR FOR GOLD on a seasonal 17 year average. But they are not always big corrections. In a very strong market sometimes it’s just a sideways pullback or a quick pullback and the trend starts higher right away and then rallies to the next timeframe or resistance area.
For instance, let’s zoom in a bit on 2007. It may be difficult but try and look find the month of October on the chart below for 2007. If we hone in on there we can see that after a sideways first half of September, October rallied straight through the month and a pullback finally developed that encompassed the month of November. It’s hard to see, but the point is that gold was so strong that even though there were cyclical forces at work gold did not sustain a hard correction, but more a sideways type of action that lasted until Thanksgiving. Once the correction was complete, gold rallied into the mid February timeframe in a most powerful move.
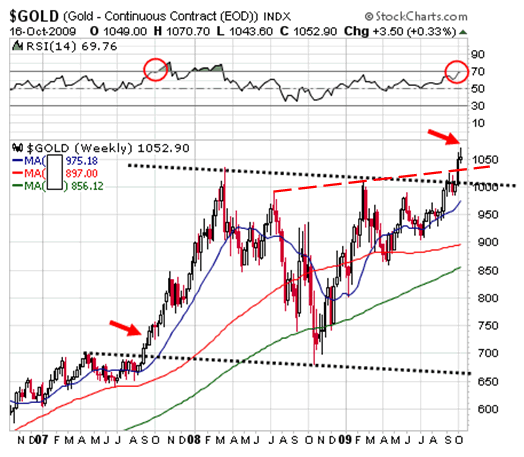
The purpose of this observation is that the FIRST OF THE FALL cycles were exacting their pull on the gold market last week. Even though we made a new high last week, the gold market has been acting in a choppy and overlapping price pattern on the shorter term charts last week. Last Thursday, gold began the first real pullback we’ve seen in October correcting from $1072 down to $1044 by Friday morning on the COMEX.
If this is a real breakout in price for gold, it should NOT CORRECT HARD because new bull legs are usually very strong and have a tendency sometimes to rally right until the November time frame.
The gold seasonal average during the last two weeks of October can see sharp pullbacks so we should not be taken aback should gold go into a corrective phase here. However, should we hold the 1044 area, last weeks low, and now make a new high, gold could move quickly in a countertrend seasonal move well above 1100.
How about a correction back to the 980-1000 by the middle to end of November? Yes. That is a possibility. While we don’t know exactly when or how much just yet, we do know that the odds favor a fall correction in gold and there are some price and time targets we could speculate on. But the KEY really is to STAY with the trend as long as it keeps making higher lows on a weekly basis. If you’re not overleveraged in gold, a pullback in November would be a great time to add to positions.
When one gathers all the technical data, the dilemma one is always faced with are the conflicting set of forces between bull and bear and it is a daunting task, especially in a market that is so charged up like gold. On the surface the fundamental and geopolitical factors seem overwhelming for gold and it is hard to imagine a scenario where gold would enter a major correction. And that is the problem with markets and perception. Let me ask the question another way. If I would have told you on March 9th, 2009 when the Dow Jones stood at 6600 that we would see Dow 10000 before Halloween you would have thought me to be insane. This breakout we are monitoring is of medium term proportion in gold and from a WORLD GLOBAL FINANCIAL observation, it is probably the most important event happening on the financial EARTH right now. Getting it right is going to make the difference in your purchasing power for years to come.
So what is an investor or trader to watch?
Is there any one indication we can look at that would put the odds in our favor that this breakout is not a fake-out?
The question of higher price, when broken to its smallest component is whether the demand (bulls) is going to OUTSTRIP the supply (bears). We have been told that the supply of gold is miniscule and there is actually more money invested in a Microsoft or a Wal-mart stock than all the gold on earth combined. The problem is that many vehicles for gold are really for paper and not for real gold. When gold and silver ETF’s were first introduced they were hailed as great investment vehicles. In retrospect, the money printers were smart enough to realize that the demand of gold would outstrip supply, and these ETF’s are nothing more than PAPER gold, which in essence has shifted the investment demand from physical to paper and has aided in price suppression. Since we’re dealing with paper, and since the governments and central banks of the world have probably been suppressing the price, gold bugs are up against a formidable enemy. This is an enemy that rarely ever loses a bet.
Confirming the breakout
In my many years of watching price charts I’ve seen numerous breakouts of one week end up being the high point and much lower prices end up coming in. But I’ve also noticed that when there are TWO WEEKLY price bars above a breakout point, the odds diminish that a breakdown will occur. And then there’s the THREE WEEKLY price bars in which the third bar makes a new WEEKLY HIGH again. This is usually a reliable signal that confirms a price move to higher levels when it is in a breakout position such as gold is right now.
Therefore, if the price of gold exceeds the 1075-1083 area the ODDS will greatly increase that a new price level in gold is about to be discovered by the markets and we would be in a confirmed new Medium Term uptrend and the 20 month consolidation should be complete.
Now, as every investor and trader knows the only guarantees we have in life are death and taxes. There are no others. It is and will always be a speculation that while the odds are in your favor, they are only odds, and as the Dow showed us this year, anything is possible in a world where you can CREATE MONEY that is backed by NOTHING. But speculating in the financial world is always an “odds” situation. You look for clues which in the past have been associated with higher or trending price.
If we move above the TOP AQUA CHANNEL in the chart below above the 1080-1085 area it would add credibility that a sustained Medium Term Breakout in Gold has occurred.
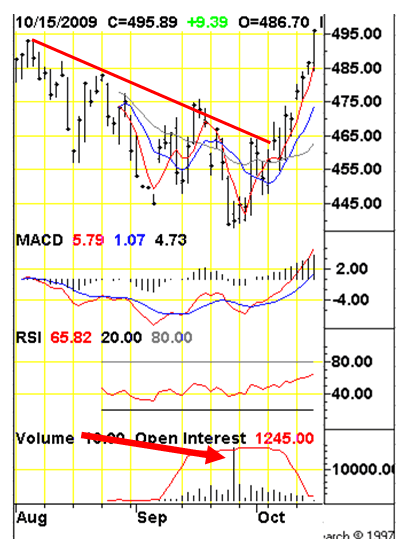
60 Minute December Gold since the rally began at the beginning of September
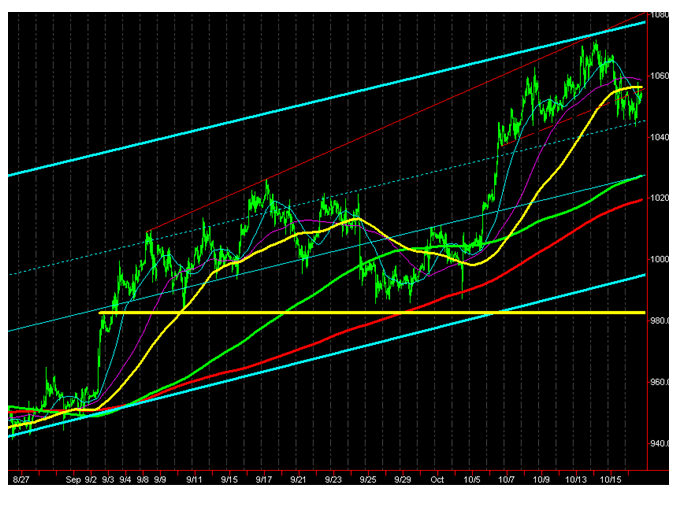
Let’s address the downside. The low in gold last Friday was a dip to the 1044 area. Upon close inspection you can see that it bounced off a tiny dotted blue trend line that was resistance for almost the entire summer. We view this area as first level support coming into this week. There is another tiny blue line just below the dotted pointing to the same price position that the green moving average currently stands at. This is the 1027 area and when combined with the red moving average on the chart, we view this as second level support at the 1020-1027 area on the short term chart. If this is a market that is ready to breakout, we should not be violating those areas in price on the downside and gold should have no business trading below that area unless we are in our fall correction.
What are the odds ………………..?
Listed below are the important price points for the last two weeks of October and how we will categorize the trend status of the medium term price breakout that we have witnessed with the breakout to new highs for more short term oriented market participants.
Anytime we move below the tiny dotted blue line on the 60 minute chart above, roughly the 1044 area in gold and where last weeks low bounced off of and it becomes resistance instead of support, then the odds will favor that gold is in a pullback mode over the short term. That dotted blue line was resistance all summer and if it now confirms support, then the potential for gold to move to new highs will increase significantly regardless of the seasonal timeframe.
Anytime price reaches the green and red moving averages on the 60 minute chart above, roughly the 1016 to 1027 price area, odds would favor gold attempting a short term bounce in price after establish a pullback low near that area. If gold is in breakout mode for October and the trend is still STRONGLY UP, we would think this area or the 1044 area would be an important support area for gold..
Anytime we drop below the 970 area, the odds for the time being, will suggest that gold has had a breakout failure and we would look for a correction low near year end 2009 before gold is ready to attempt another shot at a breakout.
Let’s look at one final chart as an indicator to watch.
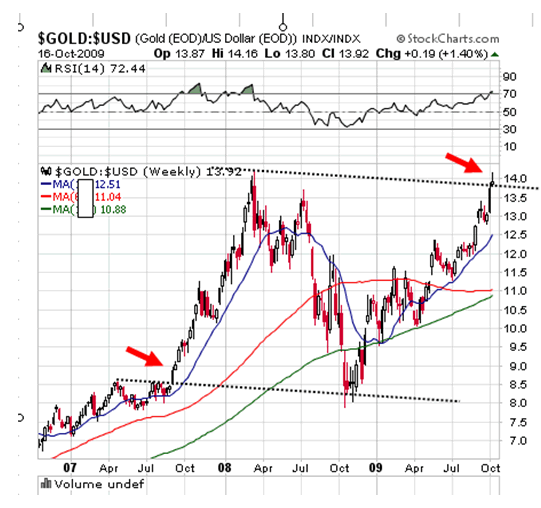
The chart above is the US Dollar versus Gold. You see the price pattern is very similar to gold’s chart but upon closer inspection we can see that the current run has not made a new high yet. While gold is at new highs, the dollar is still above the lows it established last year. Now last weeks price bar was interesting in the fact that it was the FIRST bar that moved above the upper dotted trend line and then seems to have made an exact high equal to that of March 08. Of particular note was the fact that the close was at the lows of the week just barely above the dotted line. This might be suggestive of nothing, but at a critical price point such as gold is at right now, we want to have as much confirmation as possible that gold is indeed heading to higher price targets. Should this chart hold last weeks lows and then move above its highs, it will add more confirmation that the gold move and dollar drop might be ready to move to new price levels.
EPIILOG - the upside
I’ve saved the best for last if you’re a gold bug and that’s discussing the upside.
As I’ve stated above, while there are no guarantees I’ve seen examples in commodities when prices are set up like this where huge moves can occur. As long as we continue advancing and mirroring the 2007 chart patterns as we demonstrated in the weekly chart, then the odds favor this breakout to be the real thing.
The ideal situation of course is an investor who is already long the metal and some stocks and is thinking of adding on should we get a good rally confirmation. And while adding at higher prices is difficult, it is even harder if you’re a new investor coming into the market for the first time. Many a gold bug has had their wings clipped in this fashion and when one goes for great reward, there is always great risk.
For resistance, we see the 1075-1083 area as resistance. A move above that area would suggest we’re heading towards the 1100-1150 area near term and the 1200 area in gold in early 2010.
AS LONG AS WE REMAIN above the support areas listed in this report, and the trend remains in our up channels both long and short term, gold has a good chance of making new highs into mid winter 2010.
Buying a breakout can be scary but if it’s a REAL BREAKOUT, and your positioned at the right place, you can catch the “SWEET SPOT” of the move………the spot where price enters an almost parabolic rise and the pullbacks are almost non-existent as the majority come to the point of recognition and then all jump in at once and it ignites price much higher.
If we are indeed in a breakout mode, regardless of a pullback, the price of gold will be higher by the time February of 2010 arrives. For WHAT IF purposes only, the last chart this week takes a look at what a breakout on the chart might look like come the February time frame should a true breakout be achieved.
The chart below is a look at what I’ve dubbed the 21 century gold bull market and I’ve taken the liberty to add the projected monthly bars from October to February. We are following the 2007 pattern, and as long as we continue to see the price and the indicators in the same position, we will entertain the potential to mirror that move. But even without these added bars, this bull is a thing of sheer beauty isn’t it? Over the life of this new bull, we can see that there exist three main channels. The red channel is the current bull market trend. We are at the upper end of that channel and attempting to break through it. This red channel grows almost a hundred dollars a year as gold has gone up 800 bucks over the last nine years. So it is still a very aggressive channel. Wait till the public gets interested.
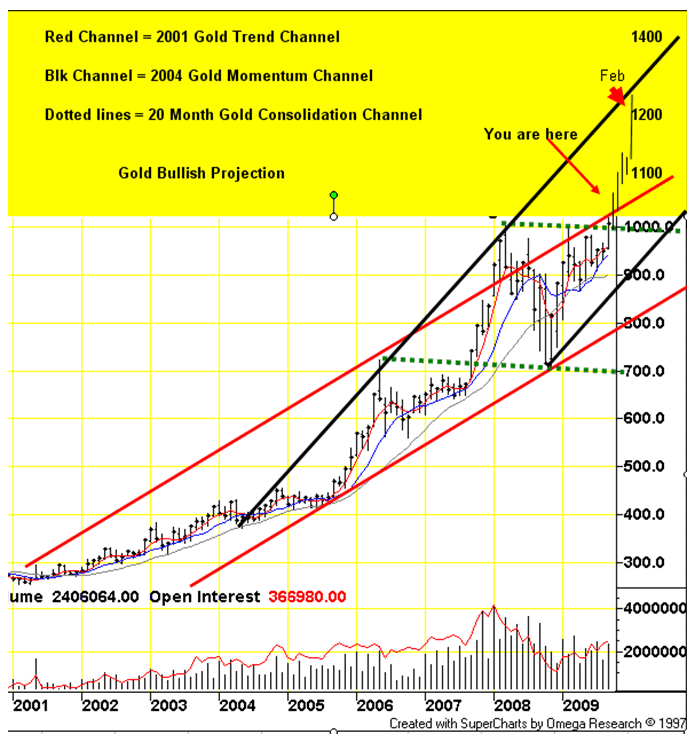
From 2004 we have a black momentum channel that has developed. A confirmed breakout here above the 1083 area would suggest that should gold follow a close symmetry to what we saw in 2007, then it could reach the top of the black channel line for a third time in this new bull market. The ideal scenario would project the mid winter peak to be near or above the 1200 dollar area in gold sometime in mid to late February.
Lastly, we have a DOTTED green sideways channel that has encompassed price for the last 20 months. Gold is currently breaking above this dotted line into new historical price territory. As long as we remain above that dotted green line, the odds favor higher prices.
Even recognizing that a fall pullback or correction is likely, gold bugs should not be dismayed as the metal is in great long term shape on the charts and as long as it remains within the confines of these channels, the long term trend is up.
BOTTOM LINE:
Regardless of an autumn correction, the prospects for gold look fantastic for the next few years. I think the only thing that could derail the gold market (and everything else for that manner) would be if we had a systemic meltdown of the financial system as a mass credit contraction wipes out all assets. Even then, what would arise from the ashes? Gold would. At this point in the cycle, we are observing a price move above 1000 and a breakout above a 20 month consolidation pattern. Another new high this week would add a lot of credibility that the long term uptrend has resumed. However, should we fail to make new highs above the 1080-1085 area, we should expect an autumn pull back.
As long as the technical indicators in this report stay pegged and continue to immolate the same conditions we saw in 2007, and gold remains within the confines of its up trending channel lines, then the odds will favor higher gold prices. Should these indicators begin to perform as they did at the 2007 top, then we would expect the autumn correction. Once the fall correction is out of the way, we expect new highs in February 2010.
At Goldtrends, we follow all the timeframes of the gold market right down to the hourly trend. We are currently monitoring and watching the weekly medium term breakout potential. Gold has established the PRICE points at which the "odds" will tilt to the upside or the downside. If you like to follow along with us as we watch PRICE confirm this major trend in gold, then drop by the website (where registration is not yet required) and check out ALL of the gold and silver analysis provided there for your review.
May you all prosper in the coming weeks,
Bill
Bill Downey is an independent investor/ trader who has been involved with the study of the Gold and Silver markets since the mid 1980’s. He writes articles for public distribution for other newsletters and websites as well as his own free site at: http://www.goldtrends.net/Email: Goldtrends@gmail.com
© Copyright Bill Downey 2009
Disclaimer - The opinion expressed in this report is the opinion of the author. The information provided was researched carefully, but we cannot guarantee its total accuracy. The report is published for general information and does not address or have purpose or regard to advise specific investments to anyone in the general public. It does not recommend any specific investment advice to anyone.
© 2005-2022 http://www.MarketOracle.co.uk - The Market Oracle is a FREE Daily Financial Markets Analysis & Forecasting online publication.


