Can U.S. Q3 GDP re-ignite the S&P Rally?
Stock-Markets / Stock Index Trading Oct 30, 2009 - 05:05 AM GMTBy: Seven_Days_Ahead
 The Technical Trader’s view:
WEEKLY CHART
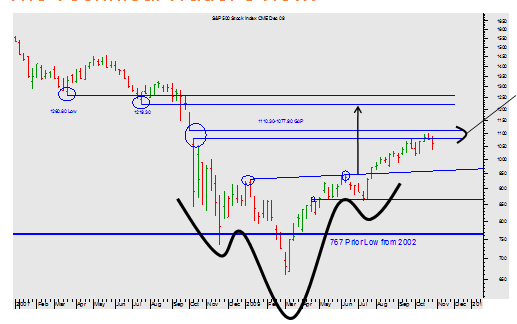
Technically, in the weekly chart, the market is under some strain through the influence of the Gap resistance 1110-1077.
 |
The bull target of the Head and Shoulders pattern is well known to be a good deal higher still at 1250 or so, coinciding with the horizontal resistance from the Prior Lows in March and July 2007. But the Gap resistance lies in the way. The bull run since the completion of the Head and shoulder pattern is impressive, with few pull-backs of note. But it’s certainly plausible, still within the context of a medium-term bull market that there may be more of a pull-back even as far as the Neckline currently at about 960 than we have had hitherto. Look closer for more short-tem evidence. |
|
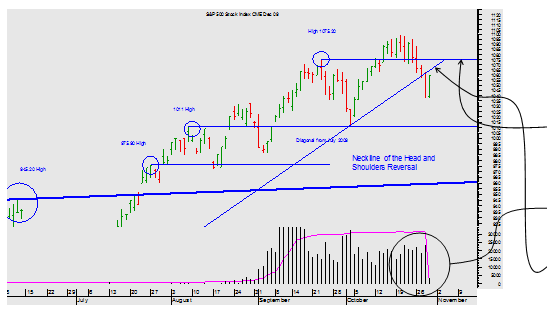
DAILY CHART The short-term signals are not good for the market. The failure to stay above the 1075 level should be a big disappointment for the bulls. Volumes have been good on down days The diagonal above the market at 1064 is now first resistance. And then just above that the old level of 1075 may yet stifle rallies too. We think the bulls are on the back foot because the market is still vulnerable to any bad news rather than excited by good news thus a retest of the 1011 level is still likely. |
The Macro Trader’s view:
Until last Thursday the S&P 500 looked on course to extend the recent Bull Run, as Q3 Corporate profit reports were largely positive, luring investors back into equities. But the positive tone was undermined by several weaker-than-expected US data releases throughout the week. Moreover, although US Existing Home sales came in better than expected on Friday, ending the week on a positive tone, traders were un-nerved.
With Q3 GDP data due, traders began taking profit and reducing positions, ahead of a number that was widely expected to mark the end of the US recession. But last Friday the UK Q3 GDP came in much weaker than expected. This was contrary to market consensus which was expecting to see confirmation that the UK recession had drawn to a close.
With this in mind, it is understandable why US and global markets generally have experienced an increase in risk aversion. Sentiment hasn’t been helped by a weaker-than-expected New Home sales report released yesterday.
But in the event, Q3 GDP (released today) came in better than expected, with most sectors contributing to the recovery. Yet several analysts sought to play down the data by claiming it was achieved solely on the back of fiscal stimulus, mainly the government’s ‘cash for clunkers’ scheme and tax credits given to first-time buyers.
But Q3 GDP wasn’t only boosted by auto sales. Retail sales generally made a solid contribution, as did corporate investment and durable goods via exports, too.
Is this number of itself sufficient to re-establish the Bull trend? Probably not. But it does provide a floor to stocks and a cap on the Dollar’s recent recovery.
With several key data releases due next week: ISM manufacturing, ISM non-manufacturing and non-farm payroll, the stage is set, if all goes well, for the Bulls to regain control.
If next week’s data is at least in line with, or better than consensus, especially non-farm payroll at the end of the week, we judge stocks should begin to solidly test the highs. Why wouldn’t they?
After a good corporate profit reporting season, strong Q3 GDP, additional good news would serve to cement the message in trader’s minds: the US economy is on the mend and with the Fed set to leave policy on hold until Q2 2010, traders will have good reason to buy stocks.
Mark Sturdy
Philip Allwright
Seven Days Ahead
Be sure to sign up for and receive these articles automatically at Market Updates
Mark Sturdy, John Lewis & Philip Allwright, write exclusively for Seven Days Ahead a regulated financial advisor selling professional-level technical and macro analysis and high-performing trade recommendations with detailed risk control for banks, hedge funds, and expert private investors around the world. Check out our subscriptions.
© 2009 Copyright Seven Days Ahead - All Rights Reserved
Disclaimer: The above is a matter of opinion provided for general information purposes only and is not intended as investment advice. Information and analysis above are derived from sources and utilising methods believed to be reliable, but we cannot accept responsibility for any losses you may incur as a result of this analysis. Individuals should consult with their personal financial advisors.
Seven Days Ahead Archive |
© 2005-2022 http://www.MarketOracle.co.uk - The Market Oracle is a FREE Daily Financial Markets Analysis & Forecasting online publication.


