Gold Bull Market Target Revised Higher to $1400
Commodities / Gold & Silver 2009 Nov 08, 2009 - 05:09 AM GMTBy: Clive_Maund
 Last week gold's major new uptrend became established when following a successful test of support at the breakout point it advanced to new highs, indifferent to temporary dollar strength. The new uptrend is expected to be at least of similar magnitude and duration to the great uptrends of 2005 - 2006 and 2007 - 2008 and if it is we are looking at very significant gains over the intermediate-term, which is certainly suggested by the recent powerful breakouts of many junior mining stocks.
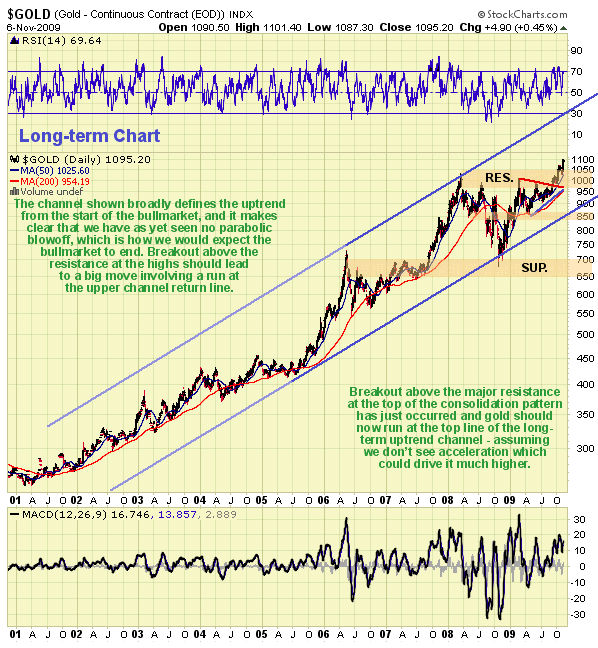
Our long-term chart which shows the bullmarket in gold from early on in this decade in its entirety enables us to define a minimum target for the uptrend, as it should at least get to the upper return line of the trend channel shown. This gives us a ballpark target at about $1400 - and it could go higher depending on when it reaches this return line, and higher still of course if it should break out of the top of this uptrend in a parabolic acceleration, which is quite possible given the worsening Fiat shambles.

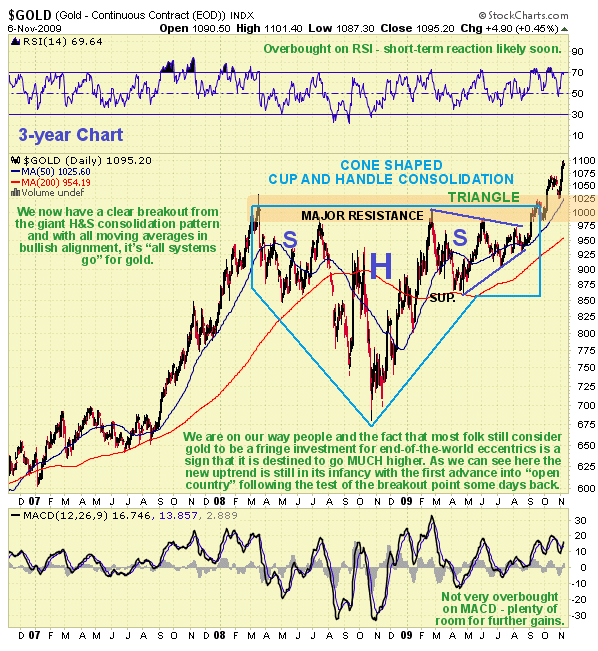
The 3-year chart enables us to review the recent giant consolidation in detail. This unusual pattern was simultaneously comprised of a Head-and-Shoulders consolidation pattern and a Cone-shaped Cup & Handle consolidation, whose "Handle" took the form of a Symmetrical Triangle. The sharp advance early last week was of the utmost importance as it took the price at last well clear of the "gravitational pull" of the giant trading range, greatly decreasing the chances that it will slump back into pattern. This advance was doubly important as it followed a successful test of support at the top of the pattern - the former strong resistance at the top of the pattern will now morph into a zone of strong support, the more so as the price climbs higher.
Moving averages are in strongly bullish alignment and are supportive of a vigorous advance lasting many months during which gold will probably remain overbought much of the time on its short to medium-term oscillators, with occasional pauses or minor reactions to ease the overbought condition. The MACD indicator shown at the bottom of the chart certainly allows for further gains over the short to medium-term. There are some wave cranks out there talking about a collapse in gold soon, but it certainly doesn't look likely on this chart, and anyway someone has to be bearish, or the advance would stop.

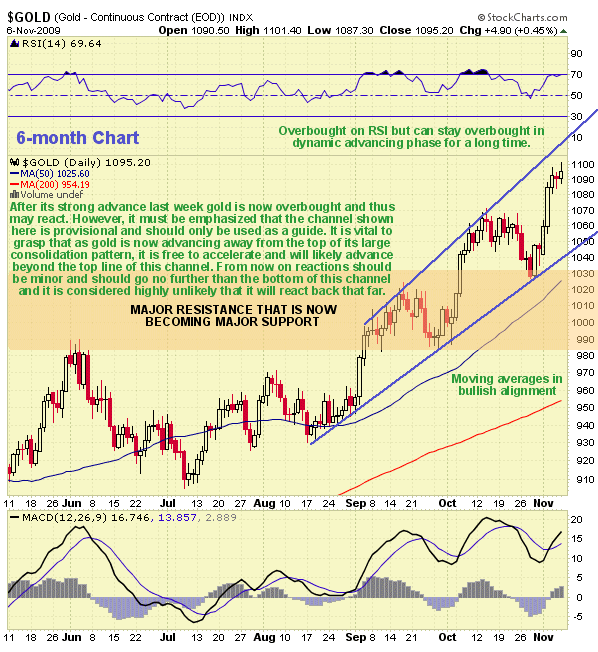
On the 6-month chart we can see how, following the breakout from the Triangle within the large consolidation pattern early in September, gold has advanced in a neat series of upwaves punctuated by orderly reactions. It was the second of these upwaves early in October that broke it out to new highs, and it was the reaction following this upwave that made the all-important test of the new strong support at the top of the giant consolidation pattern. With this test of support having been successful and followed by another upleg to new highs last week, gold is starting to get well clear of the pattern and is thus in position to accelerate away from it, which is what typically happens in this situation. It is thus clear that gold could now continue higher short-term to reach the top return line of the provisional channel shown, or accelerate beyond it before the next consolidation/reaction sets in, and while it could react back to the lower support line of the channel it is unlikely that it would drop back that far before turning up again.

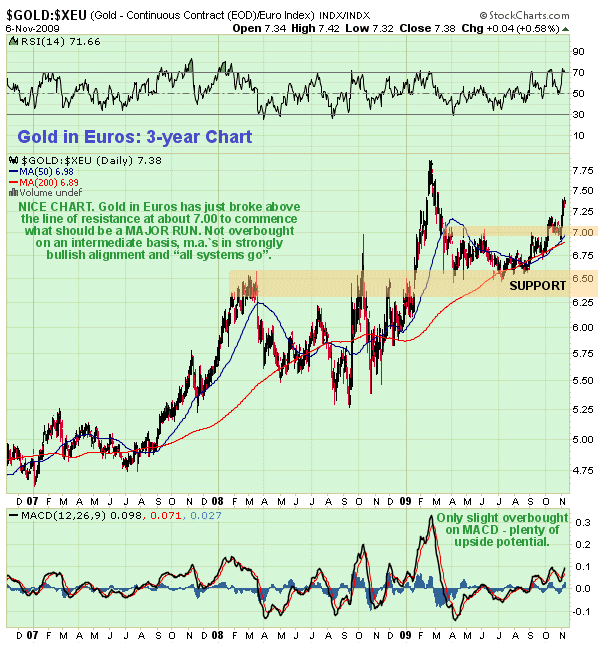
At this juncture it is highly illuminating and worthwhile to look at gold in other important currencies. As we can immediately see the 3-year chart for gold in Euros looks very positive indeed. After a strong upleg early in the year gold reacted back in classic fashion to the support at the top of the previous congestion zone in the vicinity of the 200-day moving average, where a rectangular trading range formed for many months that allowed time for the moving averages to swing back into bullish alignment, and it is no coincidence that gold has broken out upside from the trading range to commence its next run just as the positively aligned moving averages have advanced towards the top of it. On this Euro chart gold is very well paced to mount an immedaite strong advance to new highs, and the MACD indicator at the bottom of this chart shows that it certainly has the leeway to do so.

Back in August we delineated some parabolic support lines for gold on the long-term Euro chart, and it is interesting to observe that it has since gained traction at the upper one, interesting because if this line continues to hold it projects a spectacular slingshot move and soon that will exceed the wildest expectations of most observers.

A massive plus for gold - and for silver - at this time is that they are still off the radar of the vast majority of investors, who innocently believe that their Fiat masters have ridden to their rescue on the recently created tidal wave of manufactured liquidity, and consider gold and silver to be the province of fringe wing survivalist eccentrics. We are thus still a long, long way from the kind of frothy public involvement that will mark the beginning of the end of the Precious Metals bullmarket.
By Clive Maund
CliveMaund.com
For billing & subscription questions: subscriptions@clivemaund.com
© 2009 Clive Maund - The above represents the opinion and analysis of Mr. Maund, based on data available to him, at the time of writing. Mr. Maunds opinions are his own, and are not a recommendation or an offer to buy or sell securities. No responsibility can be accepted for losses that may result as a consequence of trading on the basis of this analysis.
Mr. Maund is an independent analyst who receives no compensation of any kind from any groups, individuals or corporations mentioned in his reports. As trading and investing in any financial markets may involve serious risk of loss, Mr. Maund recommends that you consult with a qualified investment advisor, one licensed by appropriate regulatory agencies in your legal jurisdiction and do your own due diligence and research when making any kind of a transaction with financial ramifications.
Clive Maund Archive |
© 2005-2022 http://www.MarketOracle.co.uk - The Market Oracle is a FREE Daily Financial Markets Analysis & Forecasting online publication.
Comments
|
Tim
08 Nov 09, 10:13 |
Gold BS
How come the gold bull supposedly missed the coming breakout higher ? http://www.marketoracle.co.uk/Article13434.html Gold is getting into critically overbought territory on its RSI indicator with its MACD showing an increasingly overbought condition, and as is very obvious on its 3-year chart, it is in a zone of heavy resistance. These factors in themselves do not preclude a breakout to new highs soon, although they do suggest that a period of consolidation first would be beneficial. However, what does make it look a lot less likely short-term is the COT structure, which according to past correlations now looks decidedly bearish. |


