


The Day the Bears Lost Control of Gold
Commodities / Gold & Silver 2009 Nov 09, 2009 - 06:26 AM GMTBy: Bill_Downey

 In was another incredible month as gold continued to outshine all other major investment themes by being the only investment that has broken out to new highs since the global meltdown of 2008. Not only is gold making new highs (1100 this week), it is doing so in a fashion that accelerated the price this week in terms of velocity, momentum, volume, and daily price range. Even the pullbacks are chart bullish recently as the best the bears can do is get gold to consolidate and trade sideways for three or four days and then gold moves up again.
This latest pullback over the last two weeks of October is a case in point. At a time when the seasonal aspect of gold points lower and at its weakest, gold's price pulled back right on queue as a price drop from 1072 to 1026 occurred. Because of gold's bullish aspect, the corrective tone was shallow. In seasonal fashion the price peak for the month occurred on October 13th, and the price retreat lasted until near the end of the month. Even the circumstances surrounding the pullback entailed options expiration and the rollover of October futures to December.
From a time element, the October pullback for gold was for the most part behaving as what gold usually does in latter October. The difference is this. The rallies are longer, and the pullbacks smaller. That statement, when broken down to its components, reflect the definition of a bull market. That's what a bull market is. It's a trend where rallies are longer and deeper on the upside, and the pullbacks are shorter and shallower in price and time. The level of that interaction in term of magnitude and duration provides the setting for how strong and powerful a bull market run or leg is. The magnitude of this event is one where gold spent 19 months hovering below the 1000 level and finally broke out to the upside.
What about the fundamental demand driving the market?
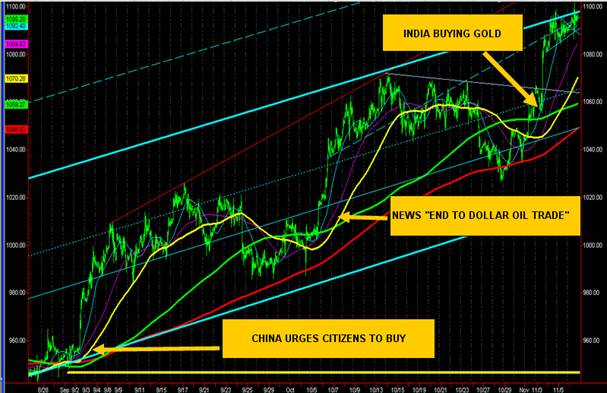
Since the beginning of September the gold price is up from 940 to 1100 in less than seventy days. What happened in late August? Technically speaking, it’s where the Bears lost control of the market. Let's look at that dynamic in action on the charts.
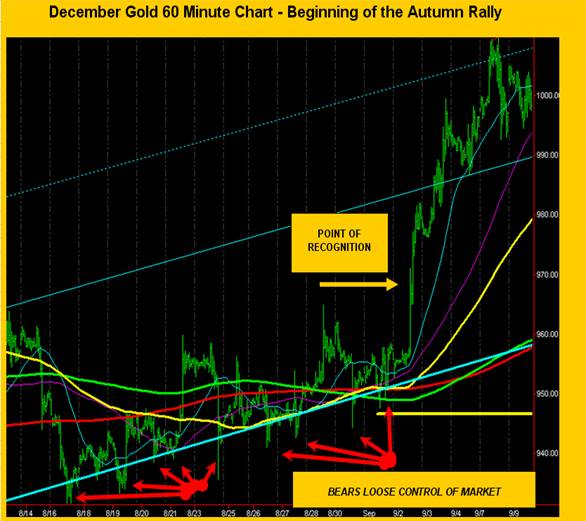
The red arrows at the bottom of the chart show the dynamics of a loss of control by the shorts. It occurred in late August.
The fat aqua trend line at the bottom of the chart is the 2009 summer channel support line. Look at how many times the bears tried to collapse this uptrend. On nine separate occasions the bears shorted this market and every spike down was GREETED WITH FRESH BUYING. It is a great display of a market turning point.
There was one final element necessary to complete the process and that was the point of recognition and that was where the shorts began to cover and NEW market participants entered at the same time. The resultant explosion in price is sometimes called the "point of recognition" where the last three highs on the charts were taken out in FIVE HOURS. That point was a MAJOR reversal of trend and therefore where the bulls retook took control of the gold market.
Was there a key fundamental change that was recognized in those few weeks by the markets? Yes. The dynamic in the above chart is where the "underlying" demand for a commodity was absolutely and totally overwhelming the supply. This is where the big market players, the commercials and the banking shorts could no longer stop the wall of buying that had materialized.
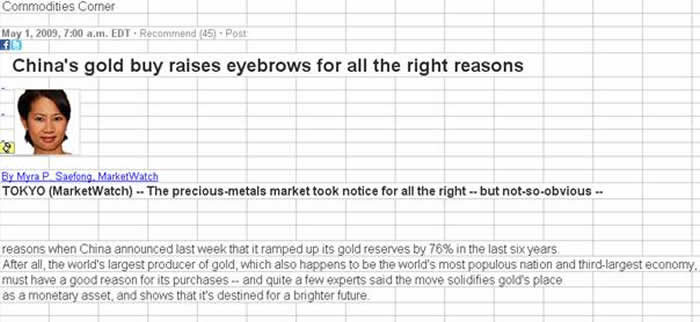
What was that wall of buying? It was the great "Wall of China." The announcements came to the forefront at the beginning of May 2009. The next phase of WW III - "The Financial war" is on. Nations have now become buyers of gold. But not just any nation is China. For a shift to gold in there foreign reserves means no other than to take existing United States dollars and purchase gold with it.
http://www.marketwatch.com/story/chinas-gold-buy-raises-eyebrows-for-right-reasons
Then the news kicked into full gear in August and the reality of gold's supply and demand equation as well as the physiological shift in investor perceptions reached a crescendo as the first trickles of investors realize that nations are buying gold and rejecting paper currency.
In bull markets, the news just keeps getting bigger and bigger. Just as the seasonal trends were about to take hold in the metals, a monthly string of announcements rattled the gold market and the effects on price is hard to dispute as you will see.
First came the September bombshell by the "Wall of China."
China urges citizens to buy gold
Sep 3, 2009
And then the October bombshell ...... "
Oil to trade in non US currency."
 The demise of the dollar
In a graphic illustration of the new world order, Arab states have launched secret moves with China, Russia and France to stop using the US currency for oil trading
And yet another bombshell delivered in November...........
"India buying gold."
Here's the result of these announcements
Usually demand from jewelry and India tail off at this point of the year, and gold corrects much harder. The reports coming from India and the jewelry market were way below average this year as well. The bear's saw their chance in September and attempted to take the market down in the latter half of the month.
But this year it’s different. The investment community has stepped in and "demanded" gold in the physical markets and the paper tigers. (futures, etf's)
Then just last week India dropped a "bunker buster" on the community by issuing a contra seasonal news story. It was BUYING GOLD!! The seasonal players, the perma bears, and the banks (who have shorted some 30% of Planet production) had to run for cover. The buying on the ask was so strong that it took back all of the selling of the past two weeks on the bid.
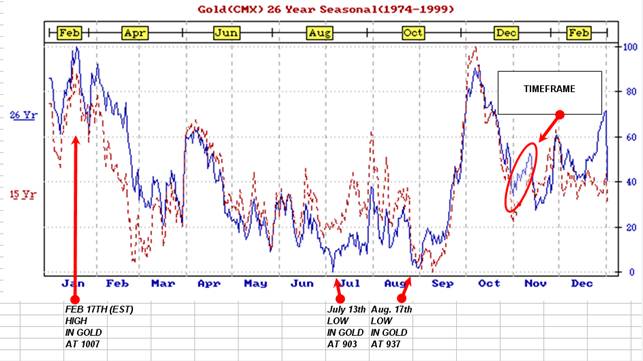
The seasonal chart below indicates the last week of October is one of the strongest down weeks of the year. And in fashion, gold did pullback in that time frame. But the bullish aspect was how little gold pulled back in price, only 46 dollars, less than 5% during the total price retreat. This time frame usually ushers in a complete retracement of the September rally.
This year's pullback in October, if we think about it, was just gold pulling back during options expiration and the rollover of the October contract. So technically speaking, that was very normal and it satisfied the October pullback.
As soon as November was ushered in, gold, like it has done in September, and October, took off running in front of the investment pack and made a new 21st century bull market high at 1100 dollars an ounce during the first seven days of the month.
The seasonal chart in the past has provided a sufficient roadmap. From the highs in February, to the lows in July and August, and the current September and October rally, the seasonal pattern has been a great guide and that is why it’s good to take look on a monthly basis.
I've drawn a red oval on the chart above to point out where we are on the timeline. This November rally we just had on the seasonal chart is usually just a fairly steady bounce on average, and a choppy motion at that. Due to its strength and the India announcement, this week in gold provided one of the best weekly gains in a while.
If we look out over the next few months we can see that the seasonal aspect of gold is now entering a time period of choppiness (Nov/Dec). This average choppiness is due to the autumn correction sometime taking place during November. The question this all brings to hand is will there be an autumn pullback in gold or is it going to keep screaming up? Let's take a look at it from a longer term standpoint.
The Medium Term Timeframe www.stockcharts.com
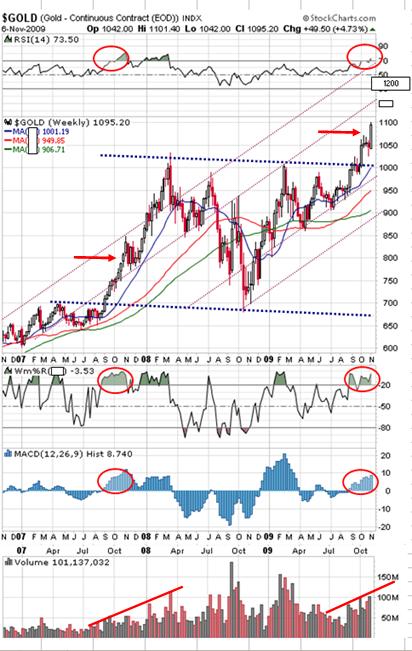
The chart above is a very bullish chart and there is a major breakout underway in gold as the culmination of the 19 month consolidation (dotted blue sideways trend lines) has come to an end. All of the technical indicators are in full gear and after a brief consolidation at the end of October gold is back on the move.
For those who have not read previous updates on the medium term trend, we're monitoring the chart pattern of 2007 and the effects of that major bull market and comparing them with the patterns and indicators currently under way in the new bull market leg since gold moved above 1030. The chart above shows the 2007 rally as well as our current progress in the current rally.
Most important is the fact that we have broken into a new zone of price parameters. The tiny purple uptrend lines on the chart above indicate where the next price resistance points should occur and where potential trend changes into corrective mode could take place.
From a price pattern standpoint, we couldn't ask for a move bullish chart. We are accelerating in price, range, and in volume. We are near the proximity of total strength as the pattern is becoming every 4th week, a major up move takes place, and then price consolidates for the next three weeks. That has been the modus operandi since the autumn rally began pretty much.
The next area of resistance should be the 1150-1175 zone and then the 1350 level.
The current three areas of support are:
1) The 1000 area where the dotted blue line and the fast blue moving average reside.
2) The 950 area where the initial autumn rally began and where medium term (red) moving average has moved up to.
3) Finally the 880-900 area where the bottom purple channel line and the long term green moving average is on the chart.
AS LONG AS WE REMAIN ABOVE THOSE PRICE ZONES, the medium term trend is up.
Let’s review the coincidental technical indicators included with the chart
1) Volume - Volume is expanding just like it did in the 2007 bull market run. (Using GLD as a proxy)
2) MACD Histogram - MACD keeps rising just like as 2007 compare the circled areas.
3) Williams %R - %R continues to be pegged in overbought area just like in 2007 and remains bullish.
4) RSI - RSI has entered overbought area just like 2007.
Conclusion: Bullish Medium Term with very strong chart characteristics. Price is accelerating. Odds favor a correction at some point but the main trend at this point is up and building strength.
Action: When RSI diverges, and %R comes out of overbought area in conjunction with price bouncing off one of these channel lines, the medium term most likely will go into corrective fashion and a pullback/correction will take place. November is the optimal time a seasonal US Dollar rally takes place, and up until last week, the rallying dollar would have brought the price of gold down. But last week, GOLD DETACHED.....and rallied while the US DOLLAR was rallying. This makes things even more bullish as now gold is rallying against the currencies. Was it just an abnormality? We can say yes once. But should it happen again in the coming weeks, we expect gold to rise against the other world currencies dismantling another bearish argument against gold.
Bearish considerations..........
Markets are one big paradox. In a runaway market, demand or psychology outstrips all bearish considerations. When it overcomes, parabolic moves up occur. Should that happen in gold, it will be the mother of all rallies as the mainstream enters. The potential to drastically move up here keeps growing by the day/week/and month.
The downside considerations are huge, especially the large short positions of the banks who are being subsidized by the feds in order to avoid an outright panic. They've sold close to 30% of this years planetary output. Yet, every pullback for a few weeks provides sideways action and then another move up, putting shorts further in trouble develops. To me, the faster this move accelerates, the more apt we are for the US Government to take more drastic measures.
Cycles
From a "CYCLES" standpoint by the folks who make a living doing it, times now couldn't be more short term bearish. There is a confluence of cycles that are due here both in the short, intermediate, and even on a medium time frame that is suggestive that gold is about to experience a pullback.
The bullish fever is growing heavy as well. How heavy? Perma Bear Bob Prechter from ELLIOT WAVE INTERNATIONAL actually mentioned that gold could move higher in his latest televised interview. Granted they are still trying to pick a top at his newsletters, and one of these months they are going to be correct. Not to bash them, I like to read the Theorist every month. But the fact that Prechter is acknowledging the potential is a change.
What is it that the cycle people see right now?
The chart above with the red arrows is a cycle that gold has been following that frequently occurs near or at the highs and once in a while at lows. We have arrived at one of these cycle turns where a high is due to occur. If we combine this with the choppy action that the seasonal charts suggest, the potential for gold to pull back is certainly a consideration.
There is no doubt that all of the cyclical and technical factors are at their maximum. The demand swell so far is out powering it. Countries and reportedly some central banks are now in accumulation of gold, and when the public arrives, it'll be a sight to see.
But what about the autumn correction? Was the 4 week consolidation in silver and the 2 week in gold the correction?
Here's the 4 potential scenario's as I see them.
1) The time frame now strongly suggests November is the prime candidate for a 4-6 week pullback before the winter rally. At its earliest, gold should peak here in the 1100-1160 area this coming week and a final move to the 980-1000 area would occur into the end of November/December time frame. We think from there gold (barring a global meltdown) could move to the 1300's by Mid February.
2) The potential for gold to continue higher here and not peak until Thanksgiving is also a potential. In that scenario, gold moves to 1175-1200 and pulls back into Xmas and New Years, and then rallies to mid February, early March.
3) An "event" sets gold off in a parabolic move and gold doesn't correct, instead, just keeps on running up from here. The chart action supports this potential and if we don't pullback in November things could get interesting very quickly.
4) Gold is peaking now and a deflationary bomb is about to hit the market as gold (and everything except the dollar) swoons lower.
Three of the four scenario's above calls for a much higher gold price. Even the 4th one calls for it. It's just that it calls for a big move down first. I have difficulty thinking gold goes to $700, but there are too many brilliant minds still entertaining a deflationary outcome. If we begin to follow their bearish script we will address the potentials. There is no need to consider it until gold breaks below the 950-975 area.
Can you imagine the United States getting in the ring with China for a fictional showdown? Satirically speaking, the American enters the ring with paper stocks, bonds, currency, toxic debt which they cannot collect, and out of control borrowing for which they can never repay, an economy whose industrial production has been gutted and shipped to Asia and who depends totally on its major competitor for its credit and purchase of most goods!!!
On the other side of the ring, the Chinese challenger enters the ring armed with gold, silver, 98% of all rare earths, energy deals with Russia and Venezuela, Iran, acquired natural resources and precious metals from Africa to Canada, all the industrial industry that USA handed to them so they could produce it for us, all of the American money, an economy that is growing at 8% GDP. Does anyone care to take a guess who is going to be calling the shorts at the G20 meeting this weekend?
On a more serious note…….
In this age, the information age, I believe World War III is already underway and is not fought with guns and butter. It’s fought with gold and hard assets and not paper. It is a financial war and the goal of the enemy is to acquire the wealth of and usurp the power of the USA without firing one single shot. While USA has been at the Party the real competition for power and control have been gathering together, forming alliances, and have implemented a plan to systematically dismantle the United States and remove it from the world throne.
In this War, the "no-bullet" war, the removal from the throne cannot be stopped because of the method of extraction. Just like in the movie "2001 - a Space Odyssey" an Astronaut dismantles a super computer that has taken over the spaceship. He simply removes the computers huge memory banks..... one bank at a time until the computer at the end is basically rendered to the capability of a person who has undergone a lobotomy. Once the astronaut gained access to the memory bank, the computer could only stand by and watch the dismantling.
By removing the dollar as the method of payment in the world Oil supply, China and a host of other nations have rendered a blow to this country akin to the memory banks being removed from HAL, the supercomputer we stated about in the last paragraph. The USA can just stand there and watch as the dollars removal of the world currency has begun, and like HAL, it is powerless to stop it.
The end of the dynasty of the 20th century known as the United States is officially over. It is bankrupt. Caput as they say. It is akin to a home owner who has defaulted on his mortgage payment and at this point, has stopped paying but is still living there, pawning off the remainder of his "stuff" before the creditors arrive and take over all the assets and remove him from the premises. At that point, no one gets paid. Not the oil man, not the phone, not the credit card, not the TV, not the car. Nothing. He/she can put it out of their minds for the time being, but the day of reckoning does arrive at some point.
The removal of the US dollar as world reserve currency is underway. China is not as far off as many think to be able to issue bonds that will be backed by the Yuan. When that happens, it'll be like that home run A-Rod hit the other night in the ninth inning (I think it was) against the Phillies in the World Series. Game over.
The real parabolic moves in gold are said to be due to inflation. Did anyone really see prices go down from 1980 to 2000? Yet gold went in a 20 year bear market. Gold goes parabolic when the faith of the government and confidence is lost by the populous which shows up through fiscal irresponsibility. The inflation is the result of that government’s inability to maintain control of all of its paper machinations and the debt machines inherently borrows to the hilt like a college student with 5 or 6 credit cards near an ATM at a package store. My point is that while inflation will come, the current threat of deflation still looms large. Once the college student is denied further credit, the party comes to an end.
Is there any event a demand for US Dollars could occur? Yes. The US DOLLAR has replaced the Yen as the "carry" trade dollar. Should the value of the US Dollar rise against foreign currencies an unwinding of the trade could develop.
All of these things have consequences that will affect gold and silver and while we do not know the future, it is difficult to see a world where gold demand will be decreasing. The exception is a complete contraction where liquidation of all assets takes place.
We've looked at the medium term picture of gold. Now let’s take a final look at a shorter term chart.
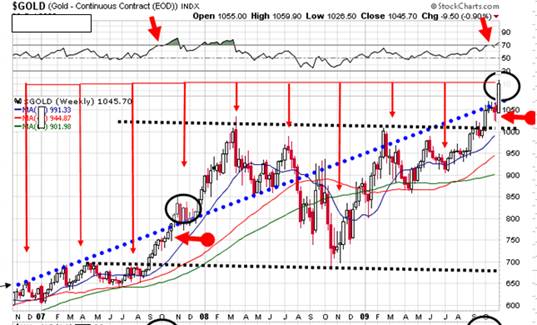
Earlier, we looked at a 3 year weekly chart of gold and we saw that gold was technically sound as a button. In the chart below, the shorter time frame points to three key price areas for the upcoming week. The is 60 minute December gold chart. There's a lot there but the basics are:
The red arrows are the short term price RESISTANCE AREAS. Take a look at the gold price right now on the chart. LOOK HOW IT IS JAMMED into the TOP OF THE FAT UPPER AQUA TREND LINE. That pattern looks very bullish and any break above that aqua area should set off a run to the other red arrows in the 1120-1140 area. Should we move and close above those lines, it will indicate that the MOMENTUM of gold is increasing.
Gold is in an uptrend channel since July (Fat aqua trend lines). Those channel trend lines define key support and resistance areas for gold's current price range and fluctuations. As long as gold is above the bottom aqua channel line, the trend is up. Within the chart there are 3 gold arrows pointing to key price support areas. Two gold arrows are pointing to the SLOW (RED) moving average. The other gold arrow is pointing to a dotted blue line. That line is short term support for the gold rally. Anytime we are above that line, the short term trend is up and climbing at about a 40 dollar per month clip.
The bottom support areas for gold is the red moving slow average and the lower aqua channel line which crosses the 1020 area.
Key turning point
The potential for gold to actually fail here and not get above the aqua line would indeed usher a correction down towards the support areas I've listed. We think this is the most important area for the week and will either provide support or resistance.
Bottom line:
We think that if there is to be a correction in gold that the most likely time for it to begin would be in November. We think it would be a pullback in a still up moving bull market, and that once completed, new highs will be upon us during the winter months.
Only moves below the 980-1000 area would warn that the medium term timeframe has issues and that a consideration of a deeper correction would be in order.
THIS WEEK -- WATCH THE 1100-1105 area.........the aqua trend line where price is at right now. A move above that area should give us a quick run towards 1150-1175. Should that area provide resistance, the potential for a pullback towards the 1060 area over the next few weeks or even a 4-6 week correction might be the modus operandi for gold.
The medium term trend of gold is up. There are usually a few times per year that gold pulls back. Autumn is one of those times. Should a correction develop, it would provide a buying opportunity in the on going bull market.
At www.Goldtrends.net , we follow all the timeframes of the gold market right down to the hourly trend. We are currently monitoring and watching the weekly medium term breakout in gold. If you like to follow along with us as we watch PRICE confirm this major trend in gold, then drop by the website (where registration is not yet required) and check out ALL of the gold and silver analysis provided there for your review.
May you all prosper in the coming weeks,
Bill Bill Downey is an independent investor/ trader who has been involved with the study of the Gold and Silver markets since the mid 1980’s. He writes articles for public distribution for other newsletters and websites as well as his own free site at: http://www.goldtrends.net/Email: Goldtrends@gmail.com
© Copyright Bill Downey 2009
Disclaimer - The opinion expressed in this report is the opinion of the author. The information provided was researched carefully, but we cannot guarantee its total accuracy. The report is published for general information and does not address or have purpose or regard to advise specific investments to anyone in the general public. It does not recommend any specific investment advice to anyone.
© 2005-2022 http://www.MarketOracle.co.uk - The Market Oracle is a FREE Daily Financial Markets Analysis & Forecasting online publication.