


Stock Market Forming a Major Top?
Stock-Markets / Technical Analysis Nov 12, 2009 - 09:33 AM GMTBy: Chris_Ciovacco

 Every time a major stock index approaches a new high, invariably we can find calls that "a major top has already been made". We have seen several such articles in recent weeks. While these incessant calls for a major top may be 100% accurate at the present time, a review of historical major tops gives little support for such a claim. A short-term top within a major bull market can occur at anytime, but major tops do not occur very often.
Fundamentals Are Improving: We also have to consider improving fundamentals when constructing a case for a major top in stocks or the lack thereof. Thursday’s unemployment report came in better than expected, but more importantly the four-week moving average of jobless claims dropped to its lowest level in almost a year. Third quarter earnings that came in above expectations, outnumbered those below expectations by a ratio of 6-to-1. Admittedly, earnings estimates in Q3 were conservative, and employment will remain weak for a time, but recent data does suggest some economic improvement.
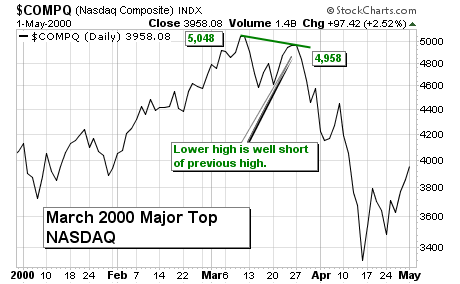
Historical Market Tops: Below we show six major tops that occurred in the Dow, S&P 500, and NASDAQ, one in each index in 2000, and one in each index in 2007. At a major top, buyers are tired and sellers are gaining strength. Consequently, after a major top, markets do not come within an eyelash of the previous highest closing high.
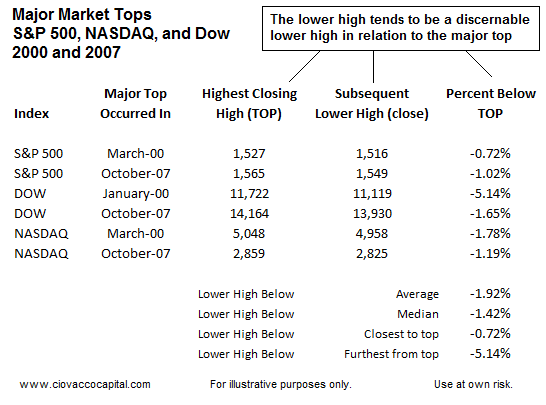
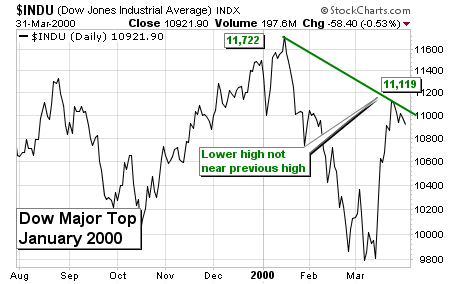
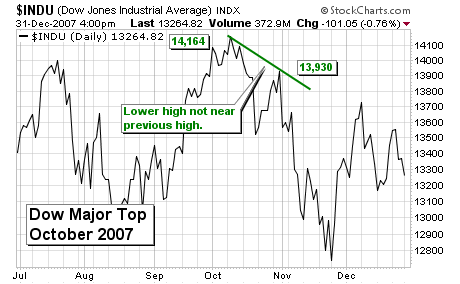
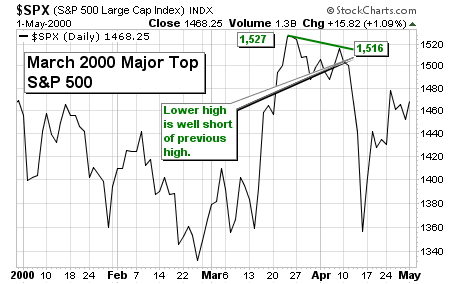
The concept of a discernible lower high is illustrated in the six charts that follow. They show what a major top looks like. Obviously, the future can bring anything in the form of a top, but understanding how human greed and fear interacted at major tops in the past may give us some valuable insight.
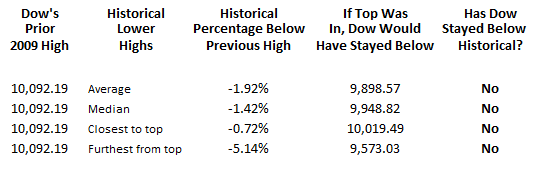
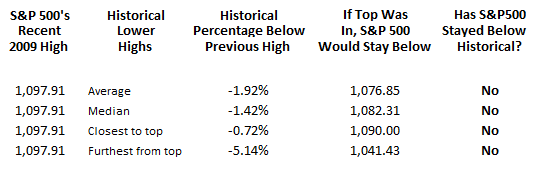
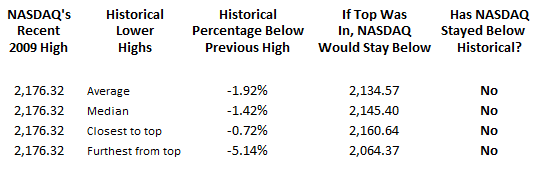
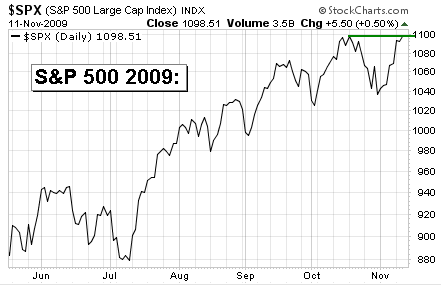
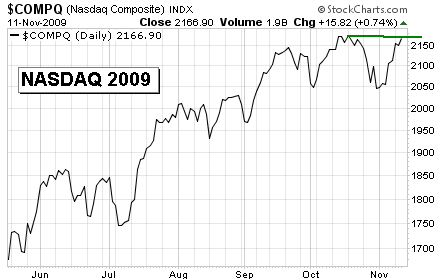
If we use recent October 2009 highs in the three major stock indexes, then we can estimate, based on history, how high current rallies could go and still leave the door open for a major top. The estimated 2009 levels to historically exclude a major top are shown in the far right side of the charts below. On Wednesday, the S&P 500 closed at 1,098.51, the Dow at 10,291.26, and the NASDAQ at 2,166.90. All three indexes have already exceeded levels which, from a historical perspective, say the 2009 markets currently look little like a major top.
Below are the 2009 charts (as of Wednesday's close) of the Dow, S&P 500, and NASDAQ. If you compare them to the charts of major tops above, you will see very little similarities. Many will point out divergences (the Dow has made a new high and the NASDAQ has not) as being bearish. A divergence that lasts a few days means little. A divergence that lasts a few weeks or a few months is a negative divergence of significance. For example in 2000, the Dow made its highest high in January. The S&P 500 and NASDAQ kept making new highs for three more months with the Dow serving as a non-confirmation or negative divergence. If the NASDAQ continues to lag behind for an extended period in 2009 without making a new high, it will become more meaningful.
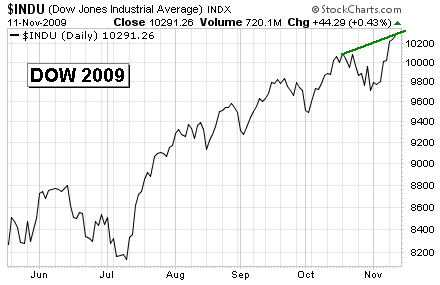
Compare and contrast the slopes of the green lines in these three charts (one above and two below) to the slopes of the green lines in the major top charts above - they do not look similar.
The comments and historical information above should not be interpreted as any forecast that a major top is not imminent. However, the historical odds do not seem to favor one occurring at this time. Experience also tells us that calling tops and bottoms is a form of forecasting, something we do not advocate. We believe technical analysis should be used to monitor the health of the markets rather than produce headline grabbing forecasts. If we see evidence that supports a major or intermediate top, we are open to such an outcome. The November Asset Class Outlook (ACO) covers corrections (a form of a market top) in terms of red flags to keep an eye out for. The ACO is available for download via this page.
Recent new highs in the Dow and the S&P 500 suggest the bulls are not weak enough yet, nor the bears strong enough yet, for the market’s tide to turn. We will monitor things closely, with an open mind, continuing to give the bullish trends the benefit of the doubt. Yesterday's article, Breadth Trying To Make Bullish Turn may help readers monitor the health of the bull market.
By Chris Ciovacco
Ciovacco Capital Management
Copyright (C) 2009 Ciovacco Capital Management, LLC All Rights Reserved.
Chris Ciovacco is the Chief Investment Officer for Ciovacco Capital Management, LLC. More on the web at www.ciovaccocapital.com
Ciovacco Capital Management, LLC is an independent money management firm based in Atlanta, Georgia. As a registered investment advisor, CCM helps individual investors, large & small; achieve improved investment results via independent research and globally diversified investment portfolios. Since we are a fee-based firm, our only objective is to help you protect and grow your assets. Our long-term, theme-oriented, buy-and-hold approach allows for portfolio rebalancing from time to time to adjust to new opportunities or changing market conditions. When looking at money managers in Atlanta, take a hard look at CCM.
All material presented herein is believed to be reliable but we cannot attest to its accuracy. Investment recommendations may change and readers are urged to check with their investment counselors and tax advisors before making any investment decisions. Opinions expressed in these reports may change without prior notice. This memorandum is based on information available to the public. No representation is made that it is accurate or complete. This memorandum is not an offer to buy or sell or a solicitation of an offer to buy or sell the securities mentioned. The investments discussed or recommended in this report may be unsuitable for investors depending on their specific investment objectives and financial position. Past performance is not necessarily a guide to future performance. The price or value of the investments to which this report relates, either directly or indirectly, may fall or rise against the interest of investors. All prices and yields contained in this report are subject to change without notice. This information is based on hypothetical assumptions and is intended for illustrative purposes only. THERE ARE NO WARRANTIES, EXPRESSED OR IMPLIED, AS TO ACCURACY, COMPLETENESS, OR RESULTS OBTAINED FROM ANY INFORMATION CONTAINED IN THIS ARTICLE. PAST PERFORMANCE DOES NOT GUARANTEE FUTURE RESULTS.
Chris Ciovacco Archive |
© 2005-2022 http://www.MarketOracle.co.uk - The Market Oracle is a FREE Daily Financial Markets Analysis & Forecasting online publication.