All That Glitters, SLV, GLD ETF's
Commodities / Gold & Silver 2009 Nov 12, 2009 - 04:20 PM GMTBy: Piazzi
 Before discussing SLV or GLD, I would like to remind you that metal ETFs are not metals. They are supposed to be backed by metals. In fact, they are no more than promises and guarantees of some entity who is supposed to have the metals. Make sure you read, and understand related prospectus and other publications as you decide whether metal ETFs are suitable for your trading/investing needs.
For new readers of my analysis, this is the color code that I use for my Objective Elliott Wave Labelling
Labeling: LEGEND
cycle ... green
primary ... blue
major ... black
intermediate ... purple
minor ... dark blue
minute ... dark green
micro ... orange
nano ... gray
pico ... red
Before discussing SLV or GLD, I would like to remind you that metal ETFs are not metals. They are supposed to be backed by metals. In fact, they are no more than promises and guarantees of some entity who is supposed to have the metals. Make sure you read, and understand related prospectus and other publications as you decide whether metal ETFs are suitable for your trading/investing needs.
For the benefit of new readers, let us re-visit the reasons why precious metals may rise in price
- A perceived political crisis
- A perceived financial crisis
- A perceived currency crisis
- A perceived inflationary future
We can sum up the above and say that, historically, gold has done well when there has been a lack of confidence in the future of the status quo. I can further condense it and say that, historically, gold has risen due to a lack of confidence in paper and/or paper pushers.
Think about it:
Political crisis comes from politicians, and politicians print papers either as money or as debt (promise of money)
Financial crisis comes from financial houses and financial houses issue papers of all sorts
Currency crisis comes from paper.
So, do we have a real paper problem? I don’t know. Is there a perception of future paper problem? Based on gold and silver performance, I think so.
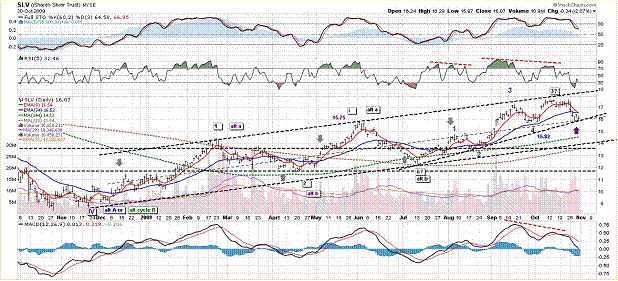
Last time I wrote about Silver ETF, SLV, was the post of November 1. At the time, silver had just had a very tough week. In that post, I said
“The positive posture of the metal ETF is still intact. There is an uptrend line from 2008 which should be good enough for at least a bounce. If the bullish count is correct, the decline is Intermediate wave 4 and should not get much lower or it will run the chance of overlapping Intermediate wave 1.”
I then showed this daily chart of SLV and said
And said
“notice the spot that held the decline last week. Tightly above top of Intermediate wave 1 and right on the center line of the channel that I have drawn from December 2008, which coincides with a secondary uptrend line from July.”
At the time I proposed a number of scenarios in case correction would cut deeper and overlap the top of Intermediate wave 1 (June peak)
This is an updated daily chart of SLV
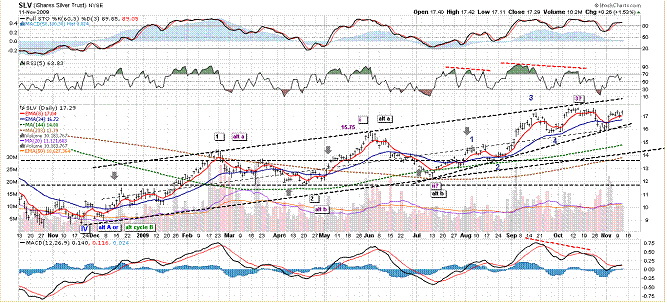
As it turned out, price did not overlap the top of Intermediate wave 1. So, I see no reason to re-evaluate my current preferred count.
The correction that started mid-October may not be over yet. If the count is correct, SLV should not overlap the top of Intermediate wave 1, and, as such, even if the correction is not over, SLV should move sideways and range-bound.
There is a multitude of support below here: the rising trend line from July, the mid channel line from December 2008, and positively aligned moving averages should offer objective areas for exit strategies depending upon a speculator’s risk parameters.
Let’s step back a little and look at the weekly chart
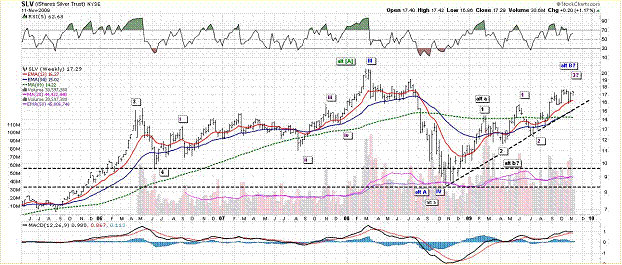
The uptrend since 2008 is still intact. There is a very strong support shelf around 14.5, and there is a long term moving average around 14.
But before all of the long term support levels are reached, if SLV goes below 15.50, I will become suspicious of my preferred count and may take a more defensive stance.
Here is a P&F chart for a quick view of important levels without much noise
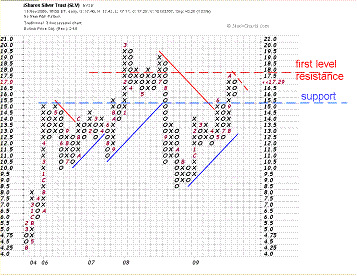
Overall SLV has a positive technical profile, and as long as it maintains its posture, I might be tempted to treat pullbacks as buying opportunities.
For SLV, I have theoretical targets of 18.50 and 19.20. Targets are theoretical and based on my technical calculations. They are nice to have. An exit strategy, on the other hand, is a must have.
The only negative I can find at this time is the fact that Silver has lagged gold in price achievement. It is still far below its all time high point.
Speaking of gold, this is a big picture view
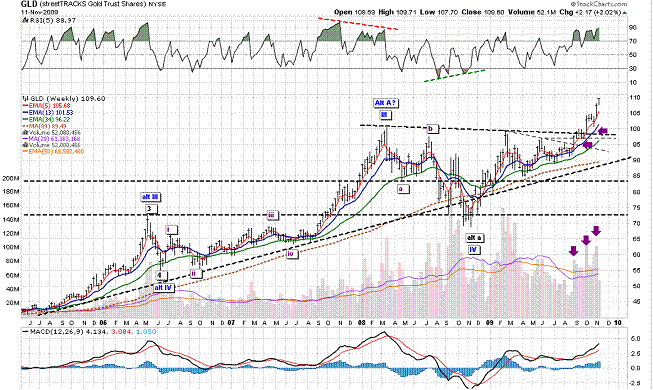
The above chart is a technician’s dream. Since its mini breakout in September GLD has not given anything back and has gone from strength to strength.
This is a daily chart of GLD
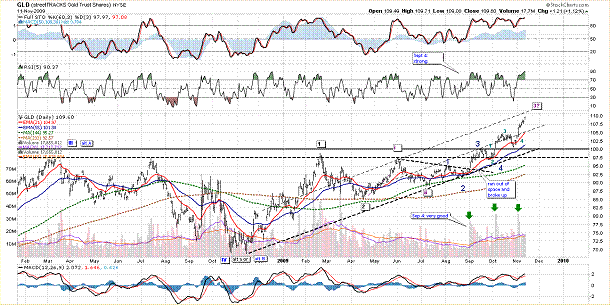
Since the breakout in September, price has impulsed higher. If my preferred count is correct, GLD seems like it is enjoying a wave extension in its Intermediate wave 3. Notice the volume spikes associated with every move from a swing low since September. There are all sorts of opinion about gold and whether it should be here, or higher, or lower. All I can say is that it is hard to argue with price while it is trending so cleanly.
GLD has a very positive technical profile at this time, and enjoys the support of its rising moving averages. That being said, GLD may be putting finishing touches on its Intermediate wave 3. If so, we may soon have a period of correction/consolidation.
For GLD I had two targets: 106, and 110. Both have been achieved, well, we hit 109.60 today. Next targets are 110, 113.50, 116.50. I have a first level of support around 103. And then we have 100.
If I were in this from much lower and wanted to have a laid back approach, I might look at a P&F chart
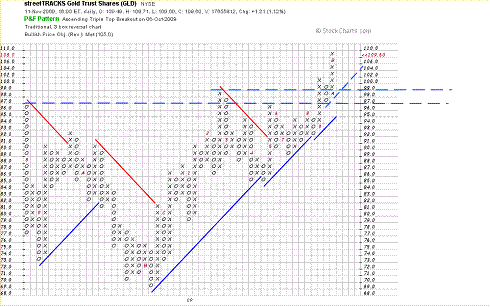
I usually find it easy to get shell shocked under constant bombardment of conflicting opinions about precious metals. That’s one reason I like charts. They allow me to formulate my own thoughts and arrive at my own objective entry and exit strategy.
By Piazzi
http://markettime.blogspot.com/
http://markettime.wordpress.com/
I am a self taught market participant with more than 12 years of managing my own money. My main approach is to study macro level conditions affecting the markets, and then use technical analysis to either find opportunities or stay out of trouble. Staying out of trouble (a.k.a Loss) is more important to me than making profits. In addition to my self studies of the markets, I have studied Objective Elliott Wave (OEW) under tutorship of Tony Caldaro.
© 2009 Copyright Piazzi - All Rights Reserved Disclaimer: The above is a matter of opinion provided for general information purposes only and is not intended as investment advice. Information and analysis above are derived from sources and utilising methods believed to be reliable, but we cannot accept responsibility for any losses you may incur as a result of this analysis. Individuals should consult with their personal financial advisors.
© 2005-2022 http://www.MarketOracle.co.uk - The Market Oracle is a FREE Daily Financial Markets Analysis & Forecasting online publication.


