Stock Market Rally is Worth Shorting Here
Stock-Markets / Stock Index Trading Nov 14, 2009 - 09:11 AM GMTBy: Alistair_Gilbert
 The S&P has been taking no hostages from the onslaught of Bears who have tried shorting it as it has climbed the wall of worry and advanced some 65% since the March lows. So is it worth shorting here at 1095? I am going to present here my evidence as to why I think that it is worth shorting here.
I shall start off with the DELTA software which is a system that is lunar based and gives guidance to TIMING as to when a market is meant to change direction. It gives no indication of PRICE targets. The DELTA charts, which I often use in my Reports, with kind permission from David Wilder, have a number of different Cycles from short term to medium term, to long term and super long term. The Super Long Term Cycle runs for 19 years and 5 hours and has 14 turning points over that period. Using over 200 years of data for the Dow Jones, these points have never inverted.
The most dangerous period is at the end of the Cycle, at SLTD 14. There has always been a big fall in the market between SLTD 14 and SLTD 1. The last SLTD 14 appeared in October 2007 and the previous one was in October 1987. SLTD 14 high appeared late in the Cycle, in fact, in the last possible month. It then fell to SLTD 1 which also appeared in the last possible month, in March 2009. We are currently headed up to SLTD 2 high which is due now, though it can appear as late as February 2010. So, from a big picture point of view we know that we are due a major high about now and that we will then move down to SLTD 3 low due in the second half of 2010.
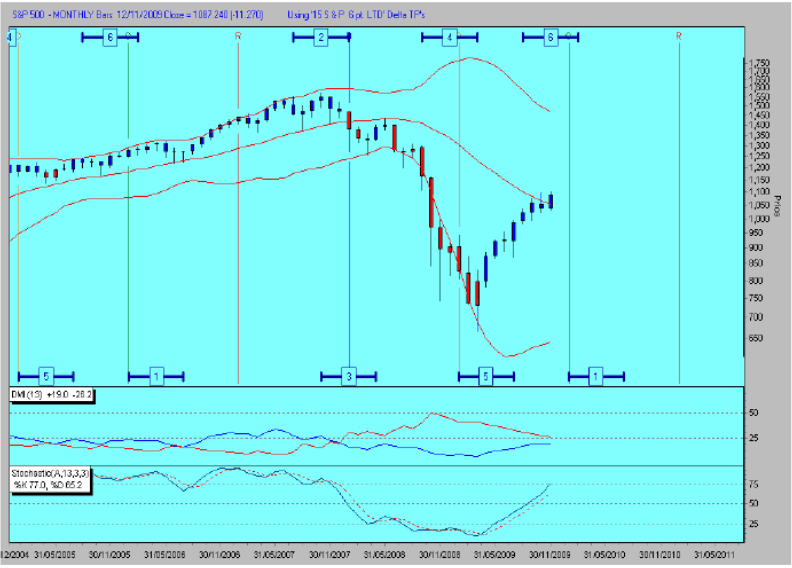
Looking at the Monthly chart above, we are due LTD 6 high around now and that the next move is down to LTD 1……the biggest moves always happen either side of point 1. If we look at the DMI Indicator, the red line is still above, which means that we are still in a bear market despite this year’s 65% rise. Looking at the Bollinger Bands, this month’s candle has pushed above the middle band (as it did last month) so needs to close the month below 1053 to confirm that we are still in a bear market.
Moving on to the DELTA Daily chart, it looks like MTD 4 arrived with ITD 5 on the 11th day of the 11th month. This then shows that we have a good trend trade down into ITD 6 and MTD 5 low and they fall due on 25th November.
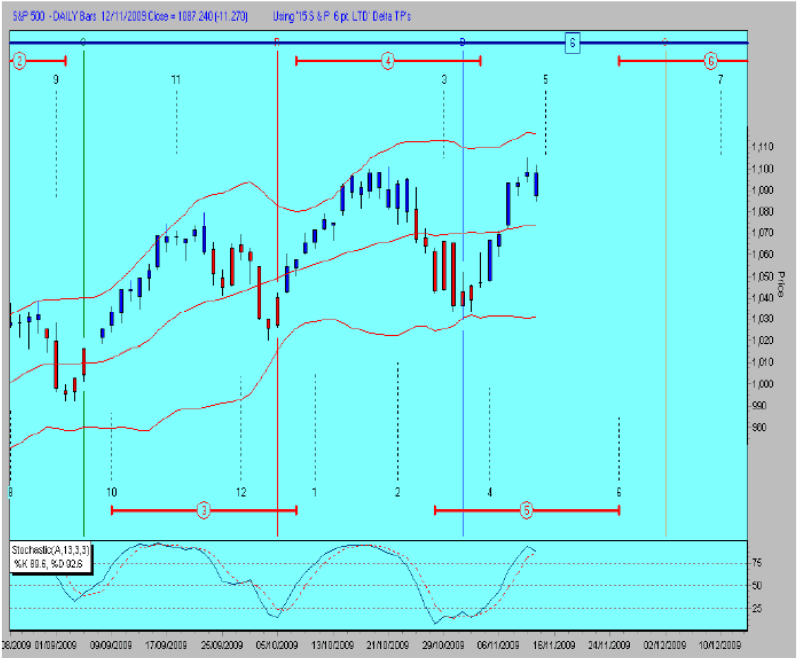
The 13 period Slow Stochastic is just moving through the moving average and confirmation of the move down will be when the Stochastic moves down through the 75 level. One thing we need to confirm the bigger move down would be a close below the 2nd November low. As can be seen on the chart, all the lows have been higher than the previous one so we need to see a PRICE move lower than 1029.38 to confirm the bigger trend is down On Wednesday the Dow Jones hit a new high for the year exactly to the day of its Fibonacci 50% retracement in PRICE as well as TIME. This is where it has retraced 50% of the fall from the October 2007 high to the March 2009 low in exactly 50% of the TIME it took to fall.
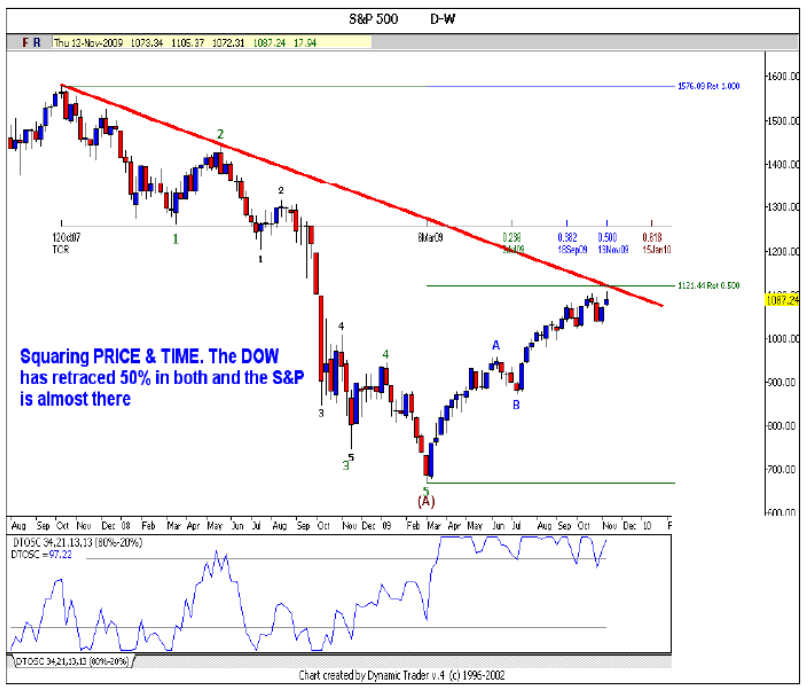
This is known as a squaring of TIME and PRICE and often leads to sharp falls thereafter. The S&P has come within 1.5% of its 50% target in PRICE in 50% of the TIME. It is also bumping up against the descending trend line from the October 2007 top which is providing resistance. The DT Oscillator has not turned down yet though it should in the next day or two.
More evidence is provided by the 61 week Cycle, due this weekend, which has a history of being followed by large falls. The last fall in September 2008 was 50% in the weeks after the Cycle. The previous date in July 2007 the market fell by 12%. The previous occasion was 9% as was the one in 2004. Beware, this should be a sharp fall over the coming weeks.
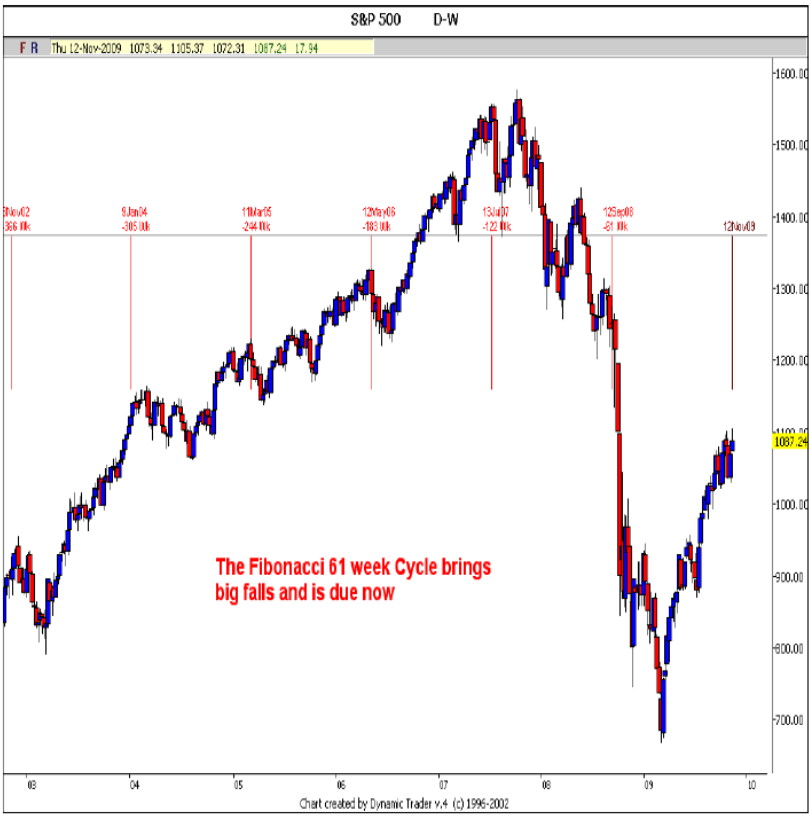
Never have I seen so many Cycles converging at the same moment in TIME. The next one is a 22 week Cycle which has precisely identified every major top this year. Sometimes these Cycles can invert to a low as happened in March 2008.
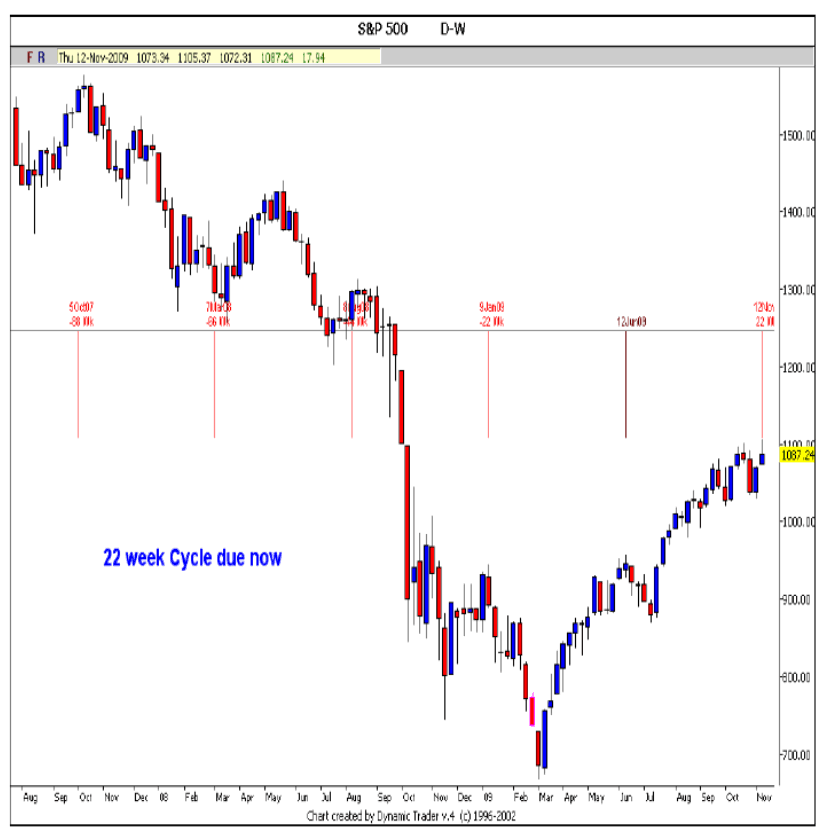
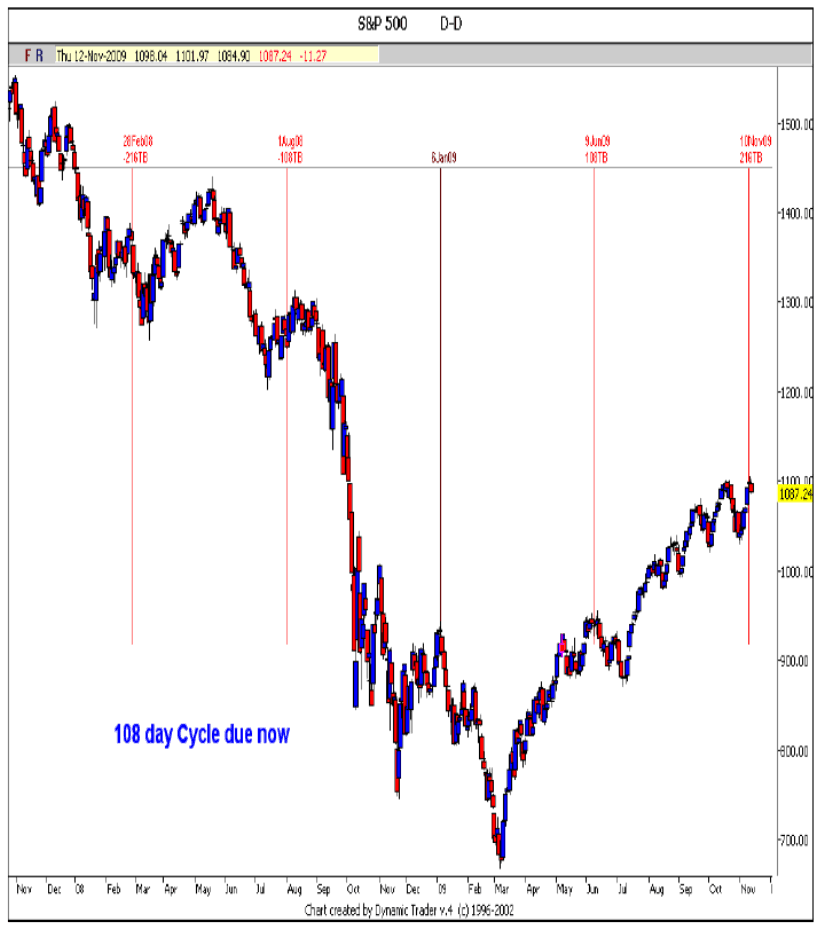
Here is another Cycle that I have run a few times before. This Cycle high brought in the DOW high a few days ago and has been very accurate apart from one failure in August 2008.
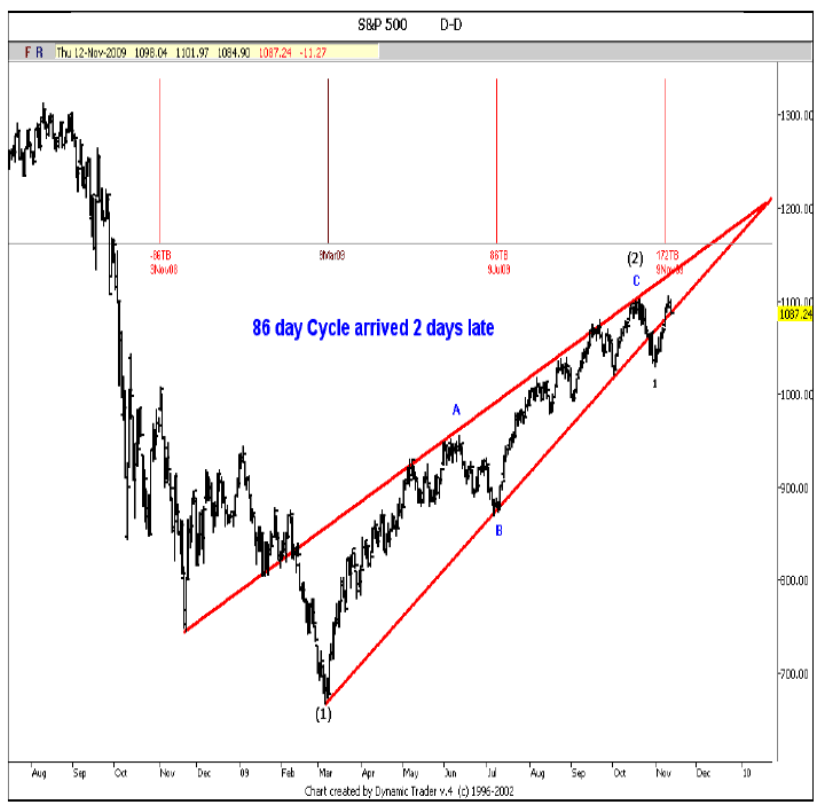
The 86 day Cycle I presented last week and it has correctly identified two highs and two lows in the last year.
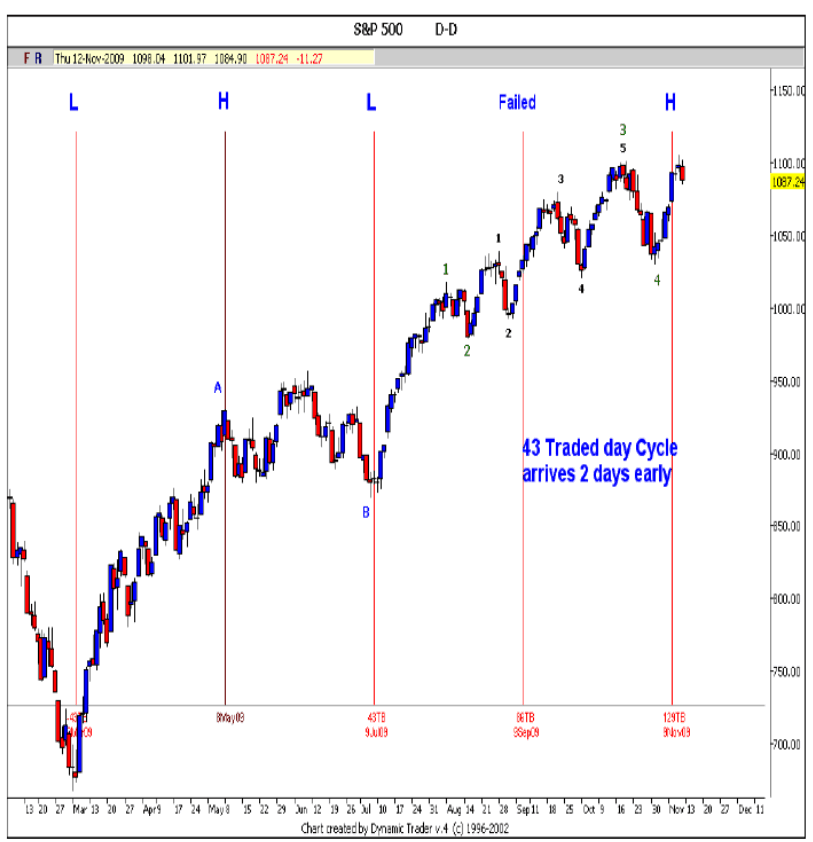
The 43 day Cycle has correctly identified two highs and two lows this year though it had one failure also, arriving 4 days late in September 2009. I normally allow two days variance either side.
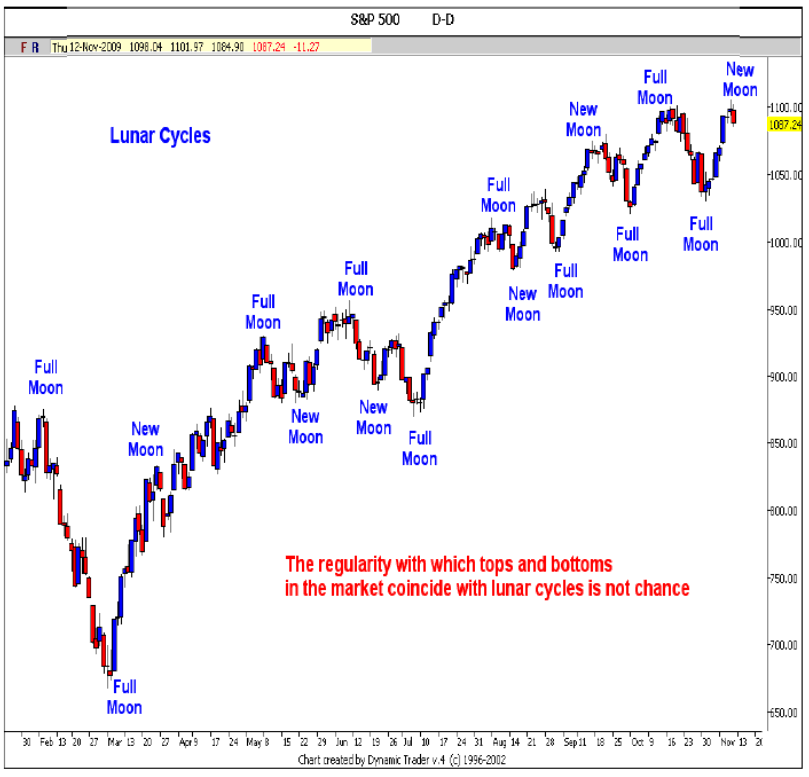
My final piece of evidence of a likely top here is this chart that I have compiled of the Lunar Cycles this year. Nearly every top or bottom in the market has been brought in by a change in the moon’s cycle. Is it not incredible that with all the millions of transactions that take place on the exchanges every day that this should happen so accurately? A New Moon is due on Monday – Beware!
Major tops are normally brought in by major divergences in the markets. The DOW Transports have not confirmed the new high in the DOW and S&P this week. The Russell 2000 is also lagging. Many sectors are falling while a few heavyweights drag the DOW higher. Volume is dropping, and Money Flow is exiting fast and has been for weeks. The Dollar has turned sharply higher this week at the same time as Gold has been hitting new highs……and yet Silver, Platinum, HUI and GDX have not been anywhere near their highs. This is now a dangerous market that is overdue a correction.
By Alistair Gilbert
ALISTAIR GILBERT has worked in the markets for over 30 years. He has worked as an institutional research analyst for a firm of stockbrokers where he got his grounding as a technical analyst. He has also worked as branch manager of a firm of stockbrokers managing private client portfolios and as a fund manager for a leading merchant bank. Alistair was also Managing Director of a Swiss Fund Management group with over $1 billion under management and developed the business extensively in the Middle East.
Alistair has now returned to his native England where he now specialises in TIME and PRICE analysis utilising Elliott Wave, DELTA and a range of technical indicators. I can be contacted via alistair@alistairgilbert.com
Disclaimer: The ideas expressed in this Report are the thoughts of Alistair Gilbert and represent part of the intricate process that he goes through before arriving at a trading decision and as such are like a trading diary. Alistair Gilbert is not an authorised investment adviser and as such none of his statements should be construed as investment advice. The value of investments can go up as well as down and trading is very high risk. Readers are advised to consult with their own investment advisers who may be better qualified to offer a trading strategy based on your own individual circumstances.
Alistair Gilbert Archive |
© 2005-2022 http://www.MarketOracle.co.uk - The Market Oracle is a FREE Daily Financial Markets Analysis & Forecasting online publication.


