GDP Forecasts Revised Higher and Gold Boosted by Negative Returns in All Currencies
Economics / Economic Recovery Nov 16, 2009 - 01:06 PM GMTBy: Paul_L_Kasriel
 I travel for business purposes a lot these days. Moreover, the battery life on my laptop is limited. As a result, at least these are the excuses I am offering, I do not have as much time to write as I used to. Hence the dearth of Econtrarians. Once a month we must update our economic and interest rate forecasts. Given that I have little new to say about the forecast this month, as was the case last month, I am again using the update as an opportunity to communicate some thoughts I have had over the past month but have not had the opportunity until now to jot them down.
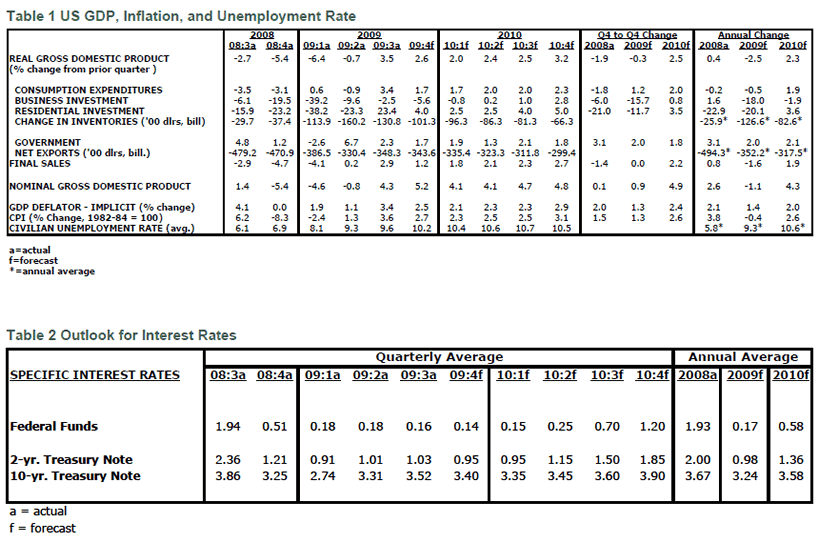
Although the forecast on an annual basis has changed little from last month, we have raised our GDP growth estimates meaningfully for the fourth quarter of this year and the first quarter of 2010. We have provided a table showing the changes in the forecast. You will notice that the sectors accounting for the bulk of the increases in projected real GDP growth are business and residential investment. Business equipment spending is rebounding faster than we expected, but by no means are we projecting a capital spending boom. The same holds true for residential investment expenditures. But we believe that the rebound in housing will be quite modest after the third quarter's 23.3% annualized surge.

U.S. Dollar Carry Trade?
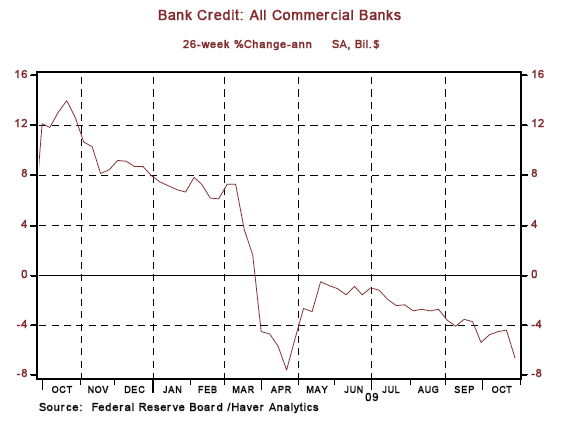
There is a lot of chatter that global speculators are borrowing greenbacks at bargain basement interest rates and buying higher-yielding assets denominated in foreign currencies. Some have suggested that this dollar-carry trade is creating yet another asset-price bubble. Other than the fact that the U.S. dollar has been depreciating on a trade-weighted basis in recent months, where is the evidence for this dollar-carry trade? In other words, where is this alleged massive bubblicious U.S. dollar credit creation showing up? I will tell you where it is not showing up - on the books of U.S. commercial banks. In the 26 weeks ended October 28, 2009, loans and investments at U.S.- domiciled commercial banks have contracted at an annual (Devil's) rate of 6.66% (see Chart 1).
Chart 1
Although total bank credit is contracting, one element of it - Treasury and Agency securities - is growing at an annual rate of 19% (see Chart 2). Banks' marginal cost of funds, the effective federal funds rate, is about 1/8%. Banks can purchase 2-year maturity Treasury securities yielding about 0.8% or bit a better (see Chart 3). Although this is not a huge positive differential, this yield-curve trade does not incur any charges against risk-based capital for banks. So, although per 100 thousand dollars, this trade does not earn much, because it incurs no risk-based capital charges, banks can engage in many hundred of thousands of dollars of the trade. This trade played a big role in recapitalizing U.S. banks in the early 1990s and it is playing the same role today.
Chart 2
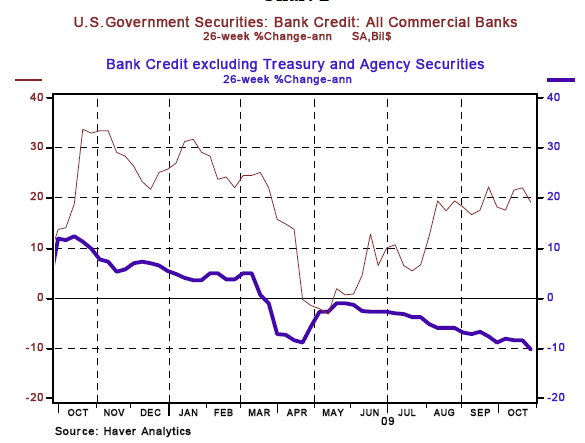
Chart 3
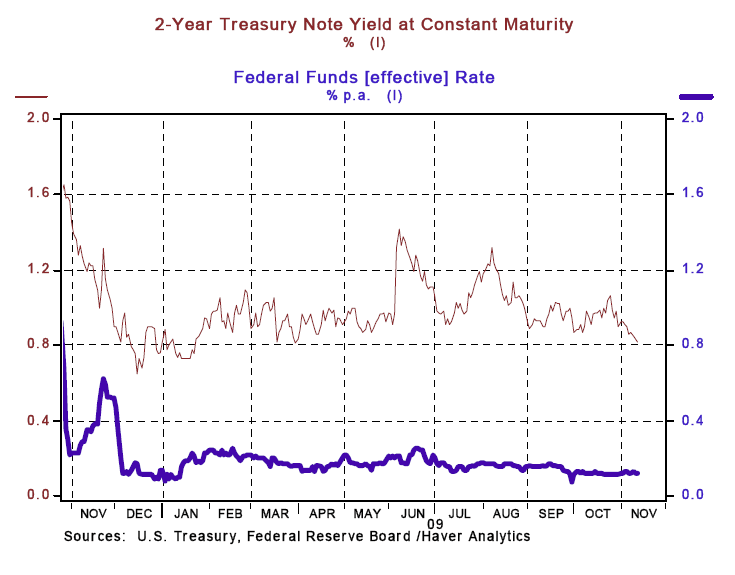
But what does this have to do with what I started out talking about - the alleged dollar carry trade? My hypothesis is that investors, rather than borrowing dollars, are selling U.S. Treasury securities that they already owned, selling them ultimately to capital-concerned/constrained banks, and are then investing the proceeds in higher-yielding foreign government securities. This would result in a weaker dollar, but does not entail any net new credit creation as banks are reducing their holdings of non-Treasury debt by more than they are increasing their holdings of Treasury/Agency debt. The upshot? Worries about a new credit bubble from a dollar carry trade are much ado about nothing.
What's Up With Gold?
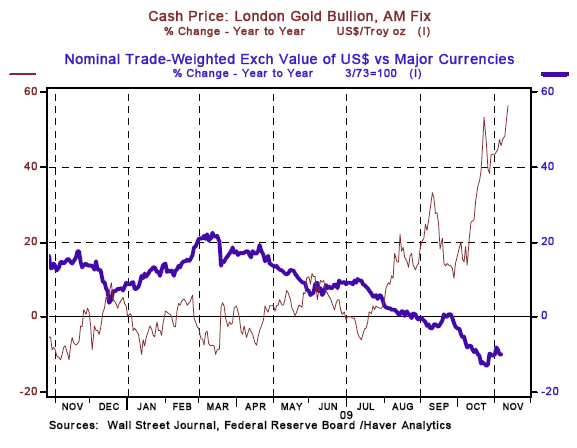
It's price, obviously. But why? The weak dollar? Yes. But Chart 4 shows that as the dollar on a trade-weighted basis has fallen against major currencies by about 10% year-over-year, the dollar price of gold has risen 56% year-over-year. The implication of this is that the price of gold has risen in terms of a composite of all major currencies, albeit more in dollar terms. So, the recent rise in the price of gold is more than just a weakening dollar issue.
Chart 4
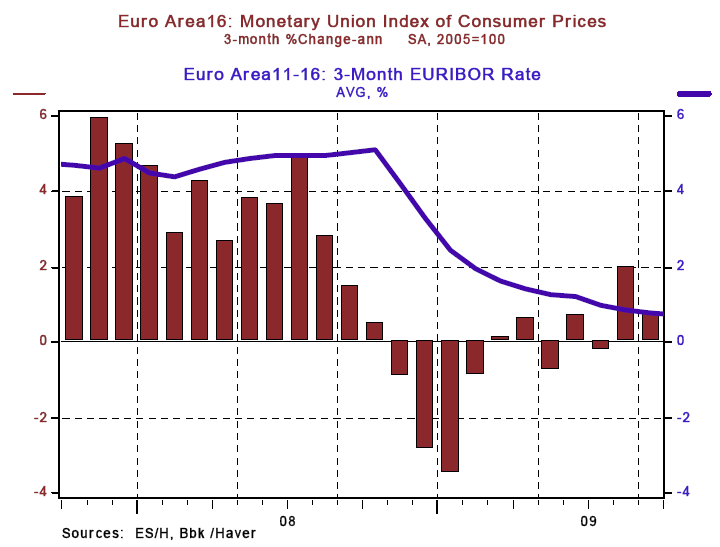
Why is gold glittering in terms of the dollar and other major currencies? Because investors cannot get an inflation-adjusted positive return on their short-term investments. This certainly is true in dollar terms, as shown in Chart 5. But it might come as surprise to some that it also is true in Euro terms as the three-month EURIBOR interest rate is the same as the three-month annualized euro-zone CPI inflation rate (see Chart 6). When global investors are unable to get an "honest" return on their short-term investments in major currency markets, they historically have turned to gold.
Chart 5
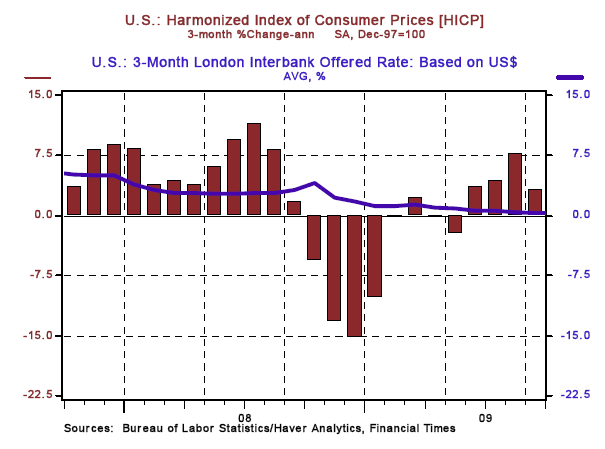
Chart 6
"Physician" Eddie, Heal Thyself!
If ever there were a nattering nabob of negativism, it would have to be the editorial board of The Wall Street Journal. It just cannot bring itself to admit that the fiscal stimulus program has stimulated some aggregate demand and some aggregate production. In its continuing policy of negativism, it published in its November 1 edition (Stimulus and the Jobless Recovery) an op-ed piece by Dr. Edward Lazear, President George W. Bush's chairperson of the Council of Economic Advisers. Eddie, as he is known by his intimates, correctly criticizes the Obama administration for its methodology in tallying the net increase in jobs that has resulted from the fiscal stimulus program.
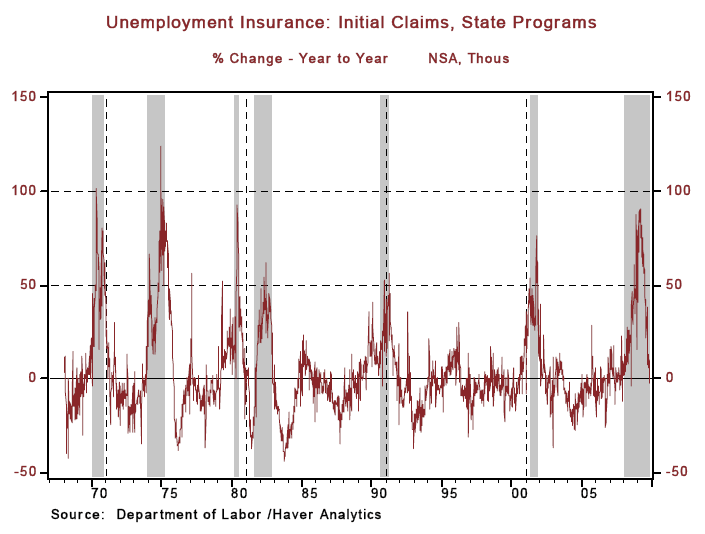
The fact of the matter is that it is impossible to accurately measure this. And we know that nonfarm employment data should be taken with a grain of salt until a number of years later when they have been calibrated with more accurate head counts from state unemployment insurance data. The current state unemployment insurance data, which do not get revised again after four weeks following their first release date, unambiguously show that a bad labor market is getting less bad. Chart 7 shows that the year-over-year change in unadjusted initial jobless claims has just entered negative terms. So, although hiring has not commenced, firing appears to have ceased, or, at least, slowed significantly.
Chart 7
But what amused me about Eddie's WSJ op-ed piece were two things - his forecasting acumen and the rate of job creation during his tenure at President Bush's Council of Economic Advisers. Eddie says that his last forecast at the Council had the economy returning to growth in 2009 without any assumption of additional fiscal stimulus. Yeah, like he thought that the incoming Democratic administration and a Democratic-majority Congress were going sit on their stimulus hands and make no attempts to revive a moribund economy. No, he assumed that they were going to adopt the economic philosophy of Andrew Mellon, President Hoover's Treasury Secretary, who recommended the liquidation of labor, the liquidation of stocks (inventories?), and the liquidation of the farmers - in essence, to purge the rottenness from the system. Of course, Eddie was going to forecast a rebound in the economy on his way out the door.
But did he forecast the Great Recession, which began on his watch? No. I had the opportunity (?) to meet with Eddie in mid January of 2007. At the time of this meeting, my Kasriel Recession Warning Index was flashing red. The Conference Board's index of Leading Economic Indicators was contracting on a year-over-year basis. So, I asked Eddie point blank if he sensed a recession coming on. His reply was emphatically "no." He told me that the leading indicator he trusted the most to signal an imminent recession was the behavior of the U.S. stock market, which continued to move higher in January of 2007. I responded that, according to this logic, he must have been equally bullish about the economy in March of 2000. By the way, the S&P 500 stock index peaked on October 9, 2007 and the economy peaked in December 2007 - thanks for the heads up, Eddie. This is how President Bush's chief economist forecasted the behavior of the economy? By concentrating on the behavior of the stock market and ignoring other proven leading indicators? I assume Eddie changed his forecasting model in his waning days as chairperson of the Council of Economic Advisers when he predicted a return to economic growth in 2009 inasmuch as the S&P 500 did not bottom until early March of 2009, when Eddie was back in academia.
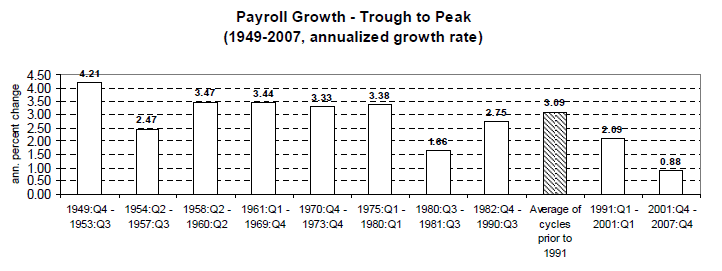
Eddie earned his academic reputation as a labor market theorist, not as a macroeconomic forecaster. So, we could forgive him if he were a bad and naïve economic forecaster. But as a labor market expert, I would have assumed that during his tenure as chairperson of the Council of Economic Advisers, policies would have been put in place that would have resulted in fantastic job creation. But alas, in the last economic expansion - Q4:2001 through Q4:2007 - the economic expansion through part of which Dr. Lazear was the president's chief economic adviser, the U.S. experienced the slowest job growth of any post-WWII expansion (see Chart 8). And yet, Dr. Lazear has the chutzpah to criticize the lack of job growth emanating from a fiscal stimulus program that is only about 50% fully implemented. Physician Eddie, heal thyself!
Chart 8
* Paul Kasriel is the recipient of the Lawrence R. Klein Award for Blue Chip Forecasting Accuracy
THE NORTHERN TRUST COMPANY ECONOMIC RESEARCH DEPARTMENT
November 2009 SELECTED BUSINESS INDICATORS
By Paul Kasriel and Asha Bangalore
The Northern Trust Company
Economic Research Department - Daily Global Commentary
Copyright © 2009 Paul Kasriel
Paul joined the economic research unit of The Northern Trust Company in 1986 as Vice President and Economist, being named Senior Vice President and Director of Economic Research in 2000. His economic and interest rate forecasts are used both internally and by clients. The accuracy of the Economic Research Department's forecasts has consistently been highly-ranked in the Blue Chip survey of about 50 forecasters over the years. To that point, Paul received the prestigious 2006 Lawrence R. Klein Award for having the most accurate economic forecast among the Blue Chip survey participants for the years 2002 through 2005.
The opinions expressed herein are those of the author and do not necessarily represent the views of The Northern Trust Company. The Northern Trust Company does not warrant the accuracy or completeness of information contained herein, such information is subject to change and is not intended to influence your investment decisions.
Paul L. Kasriel Archive |
© 2005-2022 http://www.MarketOracle.co.uk - The Market Oracle is a FREE Daily Financial Markets Analysis & Forecasting online publication.


