


Gold On the Fast Track Toward $1,200?
Commodities / Gold & Silver 2009 Nov 17, 2009 - 08:26 AM GMTBy: Mark_Brown

 Well, the long-expected retest and subsequent breakout of ‘$1,000 Gold’ has finally occurred, with the rally taking the cash price of the metal to the north side of the $1,100 per ounce level in relatively short order. The big question now, of course, is this – does Gold have enough investor interest behind it to push it to the next significant price level, $1,200? Let’s examine a long-term chart for cash Gold to see if we can find out if Gold can reach that price target before correcting again.
Spot Gold Trading
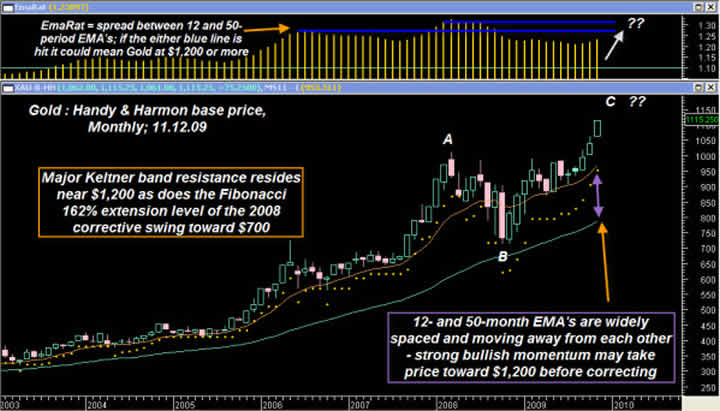
Graphic credit: Metastock v.11
All told, there isn’t much on this chart that a Goldbug wouldn’t like to see; the trend is moving higher (as in a series of higher highs and higher lows), price is accelerating up and away from the 12-month exponential moving average (EMA), the spread between the 12-month and 50-month EMA’s is rising and the 50-month EMA is also rising.
A trend that is exhibiting such upward momentum should be given every benefit of the doubt, meaning that those who are naive enough to attempt to call a ‘top’ in the Gold market at this juncture should re-examine their assumptions regarding the nature of strongly trending markets. Not that we can’t make an estimated guess at to where Gold might want to reverse and correct (a perfectly normal occurrence in every bull market), but to make weighty pronouncements that Gold must go so high and no higher, might be a bit absurd, given the moves that this metal can and does make from time to time.
However, there are various technical tools that we can employ to see just where statistical overhead resistance may reside. One simple tool is called a Fibonacci extension ratio; market technicians long ago observed that many markets will reverse/correct at the 127%, 162%, 200% and 262% extension level of any significant prior A-B swing move. For example, in the case of Gold, it made a high in March 2008 at $1,011 and then corrected lower in one major swing move down to $713 in October 2008. If we label the March 2008 swing high as ‘A’ and the October 2008 swing low as ‘B’, we simply measure the size of that A-B swing to project where the terminus of the current swing (‘C’) may eventually be.
All major charting packages offer this useful tool, and, when we plot it on our chart (omitted here for the sake of clarity) we see that the Fib 127% extension of swing A-B has already been exceeded by a price of more than $16 per ounce. That’s a pretty good indication that we should expect to see Gold power up to the next significant Fib extension ratio of 162%, which happens to be near $1,200 per ounce. Interestingly, the extreme upper Keltner band (not shown) is also near $1,200 at the time of this writing, and it will be fascinating to see how Gold reacts if and when it reaches $1,200 on this particular trend thrust. I have seen multiple cases in which Fib extension/Keltner band confluence act as powerful support or resistance barriers in any number of stocks and commodities, and Gold may also react strongly should it hit both of these powerful resistance areas at about the same time.
Finally, there is another way to measure the statistical likelihood that a trend move is ready to exhaust itself; at the top of the chart, the ‘EmaRat’ (short for EMA Ratio) indicator offers a way to measure the spread between two key EMA’s – the short-term 12-period EMA and the intermediate-term 50-period EMA. When the spread rises to (or exceeds) historically high levels, traders are advised to either run much closer stops on long positions or to prepare for a corrective move lower in which to initiate short counter-trend positions.
Presently, the spread has a ways to go before it can rise to historically high levels; the horizontal blue lines indicate the high level reached by the EmaRat indicator on each of the last two price spikes in Gold; even using conservative estimates, if the indicator makes it to the lower blue line (a 1.27 to 1 ratio between the 12 and 50-period EMA’s), Gold should be very close to $1,200 per ounce. And if the upper blue line (a 1.32 to 1 ratio between the 12 and 50-period EMA’s) is reached and/or exceeded, Gold could rise to an even higher price, perhaps to $1,250 or even $1,300 per ounce.
A parting thought for Gold bugs:
All of us truly believe that Gold is destined for much higher prices in the years to come, of that there can be little or no doubt. However, don’t let your long-term belief system cause you to freeze up, unable to take some logical profits off the table, should this thrust in Gold actually reach $1,200 or even $1,300 an ounce. Be aware that commercial interests are holding extremely large short positions in the Gold futures market right now, and be sure to use stops just in case a sudden round of selling begins to overwhelm the current uptrend in Gold. We all remember what happened in 2008, and I doubt that any of us want to get sideswiped like that again. A word to the wise should be sufficient.
By Mark Brown
To receive more information on trading ETF funds visit my website: www.ETFTradingPartner.com
Mark Brown is an independent trader who focuses on trading ETF funds. He has been involved in markets and money management since 1998. His unique trading model which uses a combination of analysis like: economy, market cycles, chart patterns, volume, market internals, and money management. Visit his site: ETF Trading Partner www.ETFTradingPartner.com
© 2009 Copyright Mark Brown - All Rights Reserved Disclaimer: The above is a matter of opinion provided for general information purposes only and is not intended as investment advice. Information and analysis above are derived from sources and utilising methods believed to be reliable, but we cannot accept responsibility for any losses you may incur as a result of this analysis. Individuals should consult with their personal financial advisors.
© 2005-2022 http://www.MarketOracle.co.uk - The Market Oracle is a FREE Daily Financial Markets Analysis & Forecasting online publication.