Friday the 13th, Welcome to the Summer Rally
Stock-Markets / Financial Markets Jul 13, 2007 - 05:57 PM GMTEverything you wanted to know about Friday the 13th .
Is it like any other day or is there something about Friday the 13th ? Wall Street appeared to have its lucky day on the 12 th , so what gives today? If you were a Knight Templar in 1307, this day goes down in infamy.
A (not so) surprising decline in June retail sales.
The article heading in CNN Money says, “ Sales drop 0.9 percent, much weaker than forecasts - a signal consumers are tired after years of heavy spending.”
Retailers are struggling with very sluggish sales. I recently visited Lowes and Home Depot and both stores only had one register working on Saturday.
Good-bye, subprime. Hello Alt – A.
While subprime borrowing has almost disappeared, Alt-A is emerging as the new kid on the block . This makes me wonder whether the same risky loans have just found another avenue for financing. If that is the case, is there yet another blow-up waiting to happen?
Meanwhile, investors aren't getting paid on about $1.2 billion of assets invested in the high-risk collateralized debt obligations (CDO) with Bear Stearns. And that is just the tip of the iceberg. Investors in pension funds, charitable organizations, university endowments and 401(k) plans are finding that their asset values are sinking unexpectedly .
What they weren't told is that the so-called high-yield debt instruments that they were sold were chock-full of toxic waste. All of this is aided and abetted by the rating agencies that are too willing to give high credit ratings to untested derivatives issued by the major banks and brokerage houses.
Merrill Lynch stopped the auction of the $850 million of CDOs it seized from Bear Stearns. It seems that the prices of these risky assets kept falling while only $200 million were sold. "God knows how low the price would have dropped if they had kept on going. We hear buyers were lobbing bids at just 30pc.” (Source: www.telegraph.co.uk)
Finally, the rating agencies are waking up to risk. USA Today reports that S&P will be lowering the credit ratings of over 600 classes of CDOs valued at over $12 billion. Many institutions will have to sell, further exacerbating the problem, since they cannot hold any debt obligations with a credit rating of less than AAA.
The Nikkei's uptrend extended…
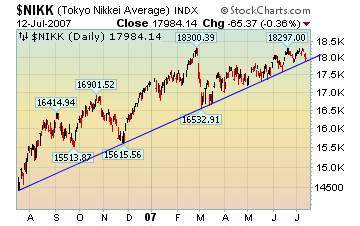
…but for how long? Last Monday the news services reported the Nikkei index at it's seven-year high. You'll notice that there are two other dates where the Nikkei was higher. That is because the news is often reported on the closing high (end of day) rather that its intra-day high. That is why there is often confusion about historical data.
While the Shanghai Composite makes a double top.
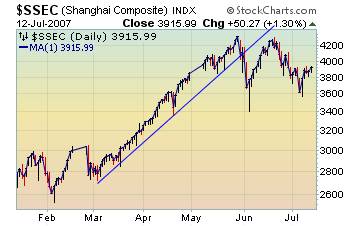 The recent five waves down doesn't speak well for the future outlook of the Shanghai Composite index. Analysts have mentioned the double top formation in this market . While I don't subscribe to that type of analysis, I do agree that the odds are now loaded against the Shanghai market.
What's all the fuss about?
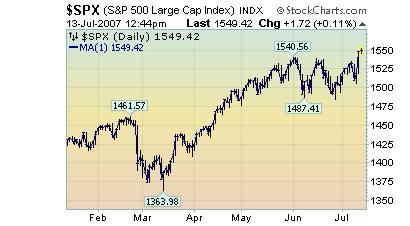 The S&P 500 rallied 1.9% yesterday, causing much jubilation among investors. The press made a big deal about the index making an all-time high. However, this was based on closing prices, not intra-day. The official (source: StockCharts.com) all-time high for the S&P 500 was 1553.11 on March 20, 2000 . As of this article, that benchmark still hasn't been bettered.
In addition, since the S&P 500 is only breaking even after seven years and four months, my recommendation to invest in money markets since that time still stands as the best investment strategy.
Are bonds due for another fall?
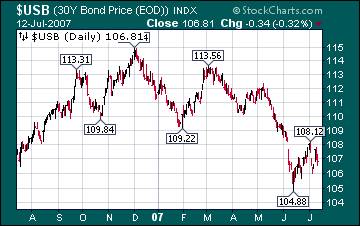
It appears that way. The Reuters headline reads, “ Bonds rise after weak retail sales data. ” In the larger context, bonds were only recovering partially from a strong sell-off in recent days. Sorry, folks, there may not be a recovery. In fact, the cyclical pattern suggest lower prices in bonds for the next month or longer. Analysts hope that some of the money escaping the subprime market will find its way to U.S, treasuries. So far, that isn't happening.
The housing market news is not getting better…
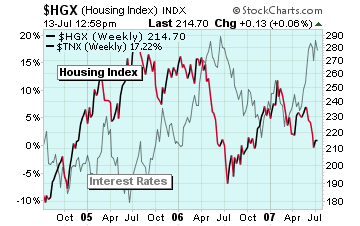
…with the announcement that General Electric is exiting the subprime market . GE??? “Don't they make dishwashers,” you ask? These guys are no longer just making appliances. They are (er, were) the fifth largest originator of subprime mortgages in the U.S. After a half billion dollars of losses in the subprime mortgage market this year, they are throwing in the towel. Homebuilders are not thrilled with the news.
The dollar is looking poorly…
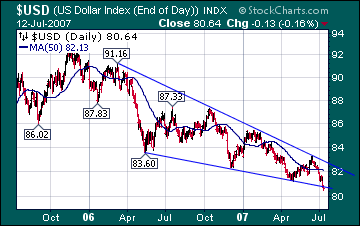 …especially after the weak retail sales report this morning. Is the dollar doomed? Maybe not. I added the dimensional pattern of a bullish wedge to the chart. This suggests that the prospects for the dollar couldn't be rosier! The dollar bounced this afternoon when the U of M Consumer sentiment report was released. It just may be what it needs to launch a change in direction.
Precious metals rallied on the dollar's seeming collapse.
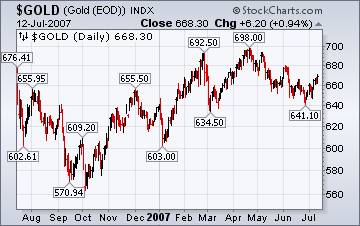 The weakness in the dollar is thought to be a large argument for higher gold prices. Look at the two charts. The relationship between the two assets isn't very strong. The fact is, gold recorded its annual high in April and has been trending downward ever since. The media is still quoting analysts who expect to see gold at $700 per ounce, based on the expected collapse of the dollar.
Gasoline prices may have seen their highs.
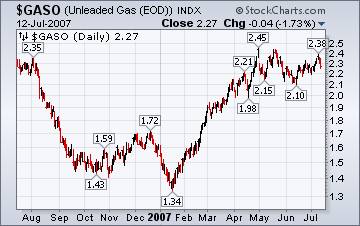 The EIA's report on Wednesday releases a study showing demand for oil and gasoline continuing to rise throughout the year. They project a further tightness in supplies as the world demand for oil increases to 3.0 billion gallons per day in the last half of the year. OPEC disagrees, suggesting that total demand is only 1.5 billion barrels per day. Is it possible that OPEC simply cannot produce any more oil and is downplaying their shortfall? We are entering the most critical time of year, where demand for oil is highest and hurricanes can do their worst. The technical outlook, however, seems a little more sanguine than the Energy Information Agency's study suggests.
This is a good-looking trend for consumers.
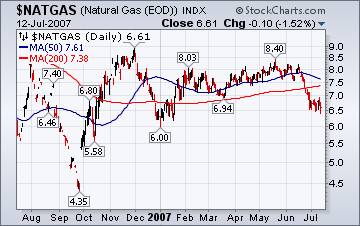 Natural gas prices rose $.05 today, but it seems that the trend to lower prices is already in place. The Energy Information Agency is talking about lower supplies and higher prices in the second half of the year, but the charts do not seem to agree. The rig count is up, suggesting that more supplies of natural gas are on their way. So far, the amount of natural gas in storage is 16.6% over its five-year average. It seems a pretty good bet that prices will be lower in the
longer term, no matter what the shorter term brings.
Back on the air again.
Tim Wood of www.cyclesman.com , John Grant and I have had a running commentary on the markets again this week. You may listen to our comments by clicking here .
Welcome to the summer rally!
Is it a one-day wonder or the start of something more? You may want to get a flavor for what has happened in the markets by listening to our newest broadcast. For those of you who are avid readers, Michael Nyquist has something to say about this rally, too. Read on!
The Practical Investor will be moving its business location at the end of July. Further updates on the move will follow.
Please make an appointment to discuss these strategies by calling me or Claire at (517) 324-8741, ext 19 or 20. Or e-mail us at tpi@thepracticalinvestor.com .
Regards,
Anthony M. Cherniawski,
President and CIO
http://www.thepracticalinvestor.com
As a State Registered Investment Advisor, The Practical Investor (TPI) manages private client investment portfolios using a proprietary investment strategy created by Chief Investment Officer Tony Cherniawski. Throughout 2000-01, when many investors felt the pain of double digit market losses, TPI successfully navigated the choppy investment waters, creating a profit for our private investment clients. With a focus on preserving assets and capitalizing on opportunities, TPI clients benefited greatly from the TPI strategies, allowing them to stay on track with their life goals
Disclaimer: It is not possible to invest directly into any index. The use of web-linked articles is meant to be informational in nature. It is not intended as an endorsement of their content and does not necessarily reflect the opinion of Anthony M. Cherniawski or The Practical Investor, LLC.
Anthony M. Cherniawski Archive |
© 2005-2022 http://www.MarketOracle.co.uk - The Market Oracle is a FREE Daily Financial Markets Analysis & Forecasting online publication.


