US Housing Market and the Stock Market
Housing-Market / US Stock Markets Jul 14, 2007 - 01:33 PM GMTBy: Tim_Wood
 I first reported publicly on October 28, 2005 that the housing market was at risk of having completed a long-term cyclical top. At that time I posted a couple of housing indexes, gave the key levels to watch and said that any such break would be a major indication that the housing market had indeed topped. This break did in fact occur with the decline into the following intermediate-term cycle low and I know that along the Gulf Coast, housing has been dead ever since.
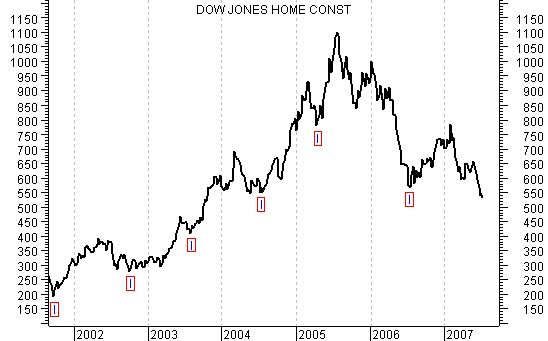
Anyway, given the more recent developments in the housing sector I feel that a follow up on housing is in order. In the first chart below we have the Dow Jones Home Construction Index. I have marked each of the intermediate-term cycle lows going back to 2003 with an “I”. Now, I want to review something here to make a point. Note how each of the advances up out of the intermediate-term cycle lows in 2002, 2003, 2004 and early 2005 were all right-translated. When I say right-translated, I simply mean that these cycles went up longer in time than they declined once they rolled over and began moving down into the next intermediate-term cycle low. Once a cycle moves up beyond the mid-point of its average duration it is considered right-translated, which is typically bullish as was indeed the case into 2005.
A right-translated cycle has a pattern of higher highs and higher lows as well. Now, note that the final advance up into the July 2005 high was only 3 months in duration from the April intermediate-term cycle low, which made that cyclical advance left-translated and bearish. Following this, there was a failed rally that peaked in January 2006, which left the cyclical structure of this index in peril and was followed by the decline into the July 2006 intermediate-term cycle low, which as you see, moved below the previous intermediate-term cycle low. The point I want to stress here is the significance between bullish right-translated cycles as opposed to the bearish left translated cycles.

Now, moving on to the July 2006 intermediate-term cycle low, price moved up into the early February peak, but having followed a left-translated cycle and after having failed to better the previous peak, this index has now declined, yet again, below the previous intermediate-term cycle low. This in turn gives us another cyclical breakdown and further confirmation that in the bigger picture the housing market should still have further on the downside to go. The Dow Jones Home Construction Index is now down some 50% from its peak.
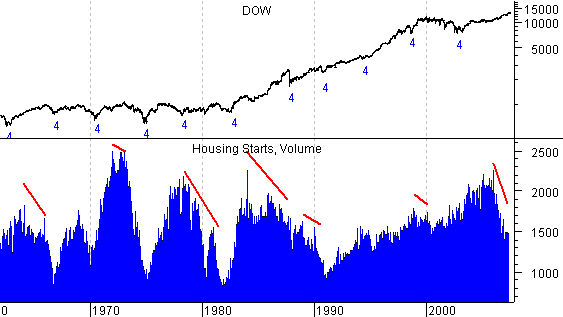
In the next chart I want to follow up on housing starts as well. This housing starts data goes back into the early 1960’s and since that time there have been 10 4-year cycles in the stock market. Note that 6 of these previous 4-year cycle tops have been preceded by a contraction in housing prices. The fact that we have now seen yet another cyclical violation in the Dow Jones Home Construction Index along with the ongoing contraction in housing starts continues to indicate that the equities markets have a major downturn ahead.

Let me also point out that from any given 4-year cycle low there has never been a contraction in housing that did not lead to the next 4-year cycle low in equities. The lead times between the duration of the contraction in housing and the ultimate downturn in the stock market has obviously varied. But, the end result has nonetheless always been the same.
The ongoing contraction in housing also suggests that my long-term data on the 4-year cycle continues to be correct in that this is a very over extended 4-year cycle, just as I have been saying all along. In the meantime, the equity markets continue to hold up and stretch even further. In fact, as of this writing my indicators are positive and the Primary trend according to Dow theory remains bullish. But, at the same time the longer-term data also continues to tell us that this is a very extended and overdone move of historic proportion and that there is a sizable downturn still to be reckoned with.
I have begun doing free Friday market commentary that is available to everyone at www.cyclesman.com/Articles.htm so please begin joining me there. Should you be interested in analysis that provides intermediate-term turn points utilizing the Cycle Turn Indicator on stock market, the dollar, bonds, gold, silver, oil, gasoline, the XAU and more, then please visit www.cyclesman.com for more details. A subscription includes access to the monthly issues of Cycles News & Views covering the Dow theory, and very detailed statistical based analysis plus updates 3 times a week
By Tim Wood
Cyclesman.com
© 2007 Cycles News & Views; All Rights Reserved
Tim Wood specialises in Dow Theory and Cycles Analysis - Should you be interested in analysis that provides intermediate-term turn points utilizing the Cycle Turn Indicator as well as coverage on the Dow theory, other price quantification methods and all the statistical data surrounding the 4-year cycle, then please visit www.cyclesman.com for more details. A subscription includes access to the monthly issues of Cycles News & Views covering the stock market, the dollar, bonds and gold. I also cover other areas of interest at important turn points such as gasoline, oil, silver, the XAU and recently I have even covered corn. I also provide updates 3 times a week plus additional weekend updates on the Cycle Turn Indicator on most all areas of concern. I also give specific expectations for turn points of the short, intermediate and longer-term cycles based on historical quantification.
Tim Wood Archive |
© 2005-2022 http://www.MarketOracle.co.uk - The Market Oracle is a FREE Daily Financial Markets Analysis & Forecasting online publication.


