


Cyclical Stock Market Highs – Secular Trends – And The Sinking Of The USS Titanic
Stock-Markets / Global Financial System Jul 16, 2007 - 09:58 AM GMTBy: Captain_Hook
 A great deal has already been written on this subject as it pertains to both stocks and commodities, with Michael Alexander's work a shining example in this regard. Of course if you were to compare how the markets are behaving in relation to how conventional analysis along these lines was foretelling what we should expect back at millennium's turn, one might be quite surprised today.
Below is a commentary that originally appeared at Treasure Chests for the benefit of subscribers on Tuesday, June 5 th , 2007.
Here, the broad measures of stocks are back at all time highs and making new ones almost everyday (more like a secular move than cyclical), which is of course contrary to expectations on the part of most market observers up until recently, even the venerable ones like Richard Russell. And the surprises don't end there, not in this day and age, where based on historical precedent concerning secular trends in interest rates, like lows seen in the 30's, again, and in terms of historical precedent , the most optimistic anticipated outcome concerning an echo bubble stock market recovery was far less than what has actually occurred. Of course these misperceptions are for lack of a better term, ‘your own fault', if not for the simple fact exploding money supply growth over the past twenty years suggested different; but more importantly, you were watching the effects of easy money policy brought about by the Fed, not the cause. Here, the causal bull market that makes the world go round is the credit bubble , with price gains in assets reflective bubbles, where one would have done better in defining the bull market in US stocks back in 2000 not in terms of tech, but rather in terms of moneychangers .
And those thinking in the same terms concerning a popping of the Chinese stock market bubble at this time are making the same mistake. This is the inference Greenspan was making in recent remarks because he knows it's the credit bubble that makes the Western Banking Model (WBM) go round, which is the central organizational construct within the global economy today. In this respect then, it's fare to say those associating a stock bubble popping party in China as cause for a finale in Western markets might be a bit off base again, with these Eastern markets still a minuscule compared to that of ‘developed' countries. Here, despite it's miraculous growth over the past few years, the Chinese stock market is still only the same size as the French stock market for example, and less than 10-percent that of US equity markets.
So again, although China maybe the engine of ‘real economy' economic growth in the world today (think manufacturing), as technology was back in the late 90's for the US, in terms of overall influence in global finance, financials, as an identifiable group, tower over such considerations. And again, this means one should be keeping a closer eye on the credit bubble at present, and bank stocks in turn, if you are attempting to divine the overall direction of equities, not Chinese stocks as a group. Of course this does not mean a popping of the Chinese stock market bubble cannot coincide with the credit bubble having increasing difficulty past this point however, which is exactly what may happen.
In order to understand this aspect of the larger credit bubble equation in the world today, one must first realize the primary reason Western bankers are taking such an interest in developing China is to capture its credit growth possibilities, as a primarily agrarian population moves to into cities in taking advantage of the ‘good life' an industrializing economy has to offer. The only thing is one has to ask, with growth so robust for years now, and with the Olympics in Beijing next year looking like a possible turning point in this respect, could it be the boom turns to bust ? This sounds like a reasonable prospect to me with contraction years associated with the Presidential cycle not far off afterward, along with the important realization that China 's economy is still primarily export led .
So you see on this basis China is still just as captive to larger credit cycle constraints as Western economies are, at least in terms of maintaining the ‘good life' (materialistic standards), where again, in terms of measuring the condition our condition is in, it makes a great deal of sense to keep an eye on the WBM, and its related equities. Here, if stocks are still a reliable discounting mechanism of the future, and if the above concerns hold any merit, they should at the very least be under-performing the larger group in signaling trouble is on the horizon, and wouldn't you know it, that's exactly what is happening. (See Figure 1)
Figure 1
In relation to the above then, given bank stocks have undoubtedly been under-performing the broad market of late, the question then begs, is it possible both this group, along with broad / global markets, begin to discount such an eventuality early (soon) in the sense both the Olympics and Presidential Election are not until next year? Answer: Based on observations associated with the above, the obvious answer to this question must be 'yes' at this point, where it would take bank shares leading the broader measure of stocks [S&P 500 (SPX)] higher in the face of rising rates to prove the opposite if history is a good guide. And what's worse in a larger sense is that not only are we facing a possible cyclical event in this regard, but in looking at the larger count again, it's quite possible we are actually witnessing something more along the lines of a secular turn , which of course would have significant long-term implications associated with the credit bubble. One thing is for sure; a fifth wave failure in the Philadelphia Bank Index (BKX) would not be a good sign in this regard. (See Figure 2)
Figure 2
Based on the fact global stock markets appear to be taking a crash in Chinese stocks quite well thus far however, it could be a rather robust short squeeze in stocks develops over the days to come, which of course could do bank shares a world of good, potentially lifting them to the Fibonacci resonance based target denoted above. Such an occurrence, with a painful squeeze in the broad / global markets, would certainly set the stage for bearish speculator exhaustion however, where again, these characters will most likely not be back for some time, not until it's time for another short squeeze. In the meantime however, the fact global stocks markets are not falling is in effect ‘good news', meaning not only is this impetus for a short covering rally, but more, bearish speculators will have little reason to short stocks afterward. Here, once all the bearish bets are either lifted or expire, stocks should fall out of bed, if only in a cyclical correction.
How could a top in stocks here usher in only a cyclical correction and not a secular turn? Furthermore, how could this be with stock markets around the world poised to plunge, North American consumers increasingly tapped out (still the big consumers on global basis), and the merger mania designed to take over for these consumers potentially set to slow any day now? Answer: Assuming any of these concerns actually materialize in the first place, meaning if price mangers can keep pressure in the pipe from fading noticeably, perhaps they will add inflationary pressure to some new measures Doug Noland points out might have bubble bolstering potential. In reading Doug's latest you would see what I am referring to is Sovereign Wealth Funds (SWF's) taking a more active role in equity markets, with China's recent investment in Blackstone getting the ball rolling for them in this department, along with hedge funds going public on the private side of the equation.
Hedge funds going public – this would make little sense in the midst of a private equity mania, no? Not to a bubble headed banker who wants to keep the wheels greased, meaning they don't care if companies are going private or public – it makes little difference to them as long as credit growth remains brisk. And of coarse it was never intended for all those companies being privatized to stay that way long if history is a good guide anyway. Yes, but are they not already going for inflated prices? While this maybe true, the balance sheets of these companies are in good condition generally, so they can be leveraged up by their new owners (notice bankers are involved here again), fat dividends declared, and then repackaged not long afterward to be put back on the market (notice big fees will be paid to bankers again) for a bag holding public to get stuck with. This is of course great work if you can get it.
As suggested in Figure 1 above however, if we get a short squeeze in stocks here that has the effect of driving interest rates higher we will have a correction in the broad measures of stocks, especially if short sellers are exhausted. What's more, if this turns out to be the case, where the shorts do in fact throw in the towel, then the correction could be quite severe, where only the shadow knows how a derivatives related (counter-party risk) bubble bursting party will turn out in the end. This of course is the message the Baltic Freight Index (BDI) is giving us right now. It's telling us to expect a turn lower in the equity complex, and that if this turn lower is more than a hiccup, asset prices will fall in direct proportion to the strength of the economy as measured by the BDI. Here for example, is the BDI juxtaposed against gold, where it appears to be leading at the moment. (See Figure 3)
Figure 3
Source: Investmenttools.com
And then there is copper. Dr. Copper has historically displayed predictive capabilities with respect to the economy. But based on the picture below, this no longer appears to be the case; at least not in the sense perhaps the BDI is a more sensitive leading indicator. At any rate, it's enough to know both of these indicators are firing a warning shot across our collective bow, a shot potentially foretelling of big trouble down the road if pressure in the pipe is not maintained. (See Figure 4)
Figure 4
Source: Investmenttools.com
Perhaps you are thinking such considerations are not of concern in our day and age? While such thinking may apply to some things, I can assure this brand of loose thinking will only get you in trouble with respect to managing risk at some point with the BDI signaling trouble ahead. In this respect, just take a look at the SPX superimposed on a BDI plot. Here, if a picture is worth a thousand words, a rational man would do well to read the fine print, that being the part disclosing markets do in fact have a risk element attached to them. As you can see below however, there is no evidence any trouble exists so far, not with all the shorts still being squeezed. (See Figure 5)
Figure 5
Source: Investmenttools.com
As pointed out above in Figure 1 however, if long-term rates rise enough stocks always respond with a correction, where up until now, the shorts have always saved the day. So, it will be interesting to see what happens to stocks after options expiry on the 15 th , only two-weeks away now, especially if a goodly number of the shorts have decided to call it quits. Right now it appears the shorts are resolved to maintaining their positions with ratios and public short thresholds still close to record highs. As pointed out above however, this could all be set to change, albeit this change could be slow as Dave reminds us once again this week. As a rehearsal for the real thing later on, we may get a taste of what is to come once June index options expire on the 15 th , where July's series will have diminished influence on the trade during the remainder of June with a five-week cycle this time around, but any weakness here should be temporary. That is to say the last two weeks of June could be quite volatile, followed by stubborn shorts squeezing prices back up as the July options series comes into play with expiry approaching. This is what Dave is suggesting, where such a sequence is repeated up until September. So you see, this is why we are not suggesting one should consider shorting stocks just yet. In this respect you should know options based floor pricing on the SPX is now established at 1520 running right through September, which is highly suggestive this view is correct.
At some point however, if not this fall, perhaps next spring as suggested by trading day comparisons in the attached analog based series , and a message that is well presented when we juxtapose long-term interest rates (TNX) along side the BDI, not too mention the message concerning the effect of rising interest rates presented in Figure 1 above, something is going to crack with relation to the asset bubbles unless an all out hyperinflationary sequence ensues. And as you can see below, this crack could easily be a crash considering how far the TNX and BDI have diverged over the past year. (See Figure 6)
Figure 6
Source: Investmenttools.com
So, as you can discern from the above then, even though it appears an ample supply of shorts will remain available to squeeze prices higher for now, considering all the water that's already gone under the bridge, it appears while stocks are supported on the downside, at the same time, in order to lift them further in meaningful fashion, a hyperinflationary sequence must ensue. Is such a thing possible on a global basis? While not knowing the answer to this question for sure, with consideration to Chinese stocks potentially being in trouble at this point, along with the Yen in position for a reversal, it appears the powers that be intend to take a swing at it, with M3 approaching a 14-percent growth rate in the States. Here, the US is kingpin, with the American consumer still number one in the world in terms of volume.
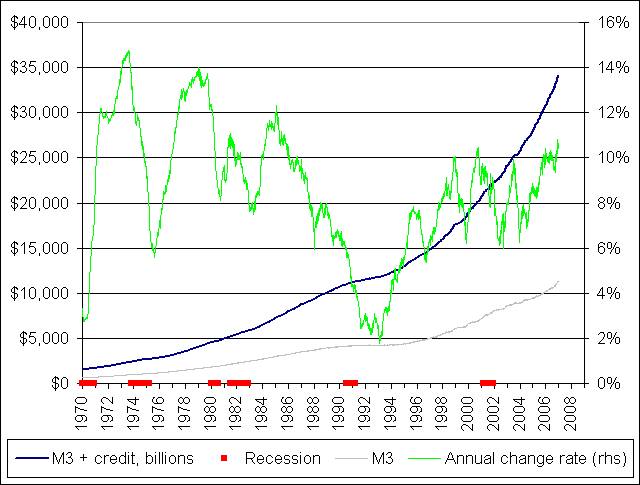
This means that if the US money machine turns the screws and floods the system with even greater quantities of ‘easy money', then the rest of the world will follow. In such an instance China 's huge foreign currency reserves would continue to grow as US consumers increase consumption of their manufactured products, while at the same time they will also see money supply growth rates accelerate with business attempting to meet this demand. Below is a look at the long-term trend in M3 growth, with the top chart in the attached series from nowandfutures.com (note the next 5 charts are sourced here) showing that the Rate Of Change (ROC) associated with growth trajectories is potentially set to bust a move higher. (See Figure 7)
Figure 7
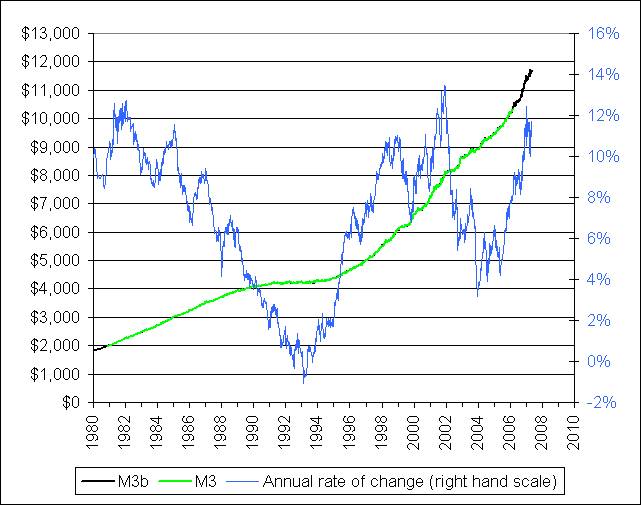
Source: nowandfutures.com
But isn't the US consumer tapped? And if so, how can such a scenario come to be? Enter the crafty moneychangers, with the Fed at center, and as Doug Noland (attached above) continues to point out to us each week, a money-manufacturing machine gone wild, meaning all the exotic forms of credit being offered are essentially beyond the direct control of central authorities. Be that as it may however, and despite the fact consumer loan growth will not constitute the lion's share of over all M3 growth (see chart below), more money will still make it out into the ‘system', albeit the Chinese manufacturing machine (and the larger Chinese economy then) may not feel the benefit. Below is a plot showing consumer loans, the health indicator of an expanding / accelerating credit cycle, apparently having trouble gaining traction in terms of growth propensities at present. (See Figure 8)
Figure 8
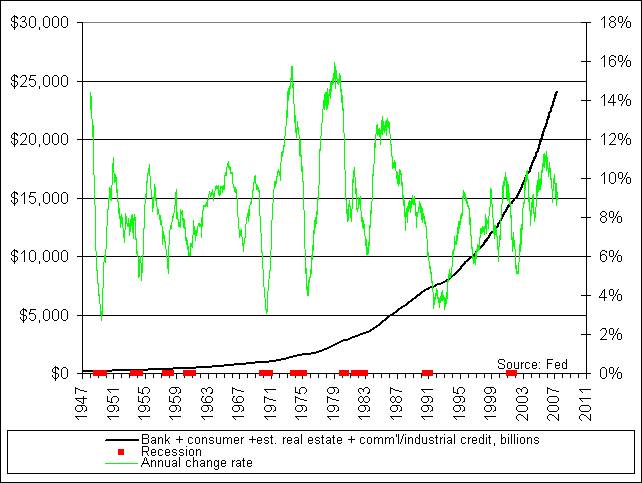
Source: nowandfutures.com
What does this all mean? It means if M3 can't growth in a healthy fashion, then, it must grow in an unhealthy fashion. And although this kind of money supply growth is of the unsustainable variety, where hyperinflationary episodes always implode onto themselves, the way our self-enriching establishment views things, such a risk is acceptable given the alternative is a loss of power, or worse. Thus, if the new money is not borrowed into existence, markets must then be monitized, where when we add M3 (measuring these monetizations) and consumer loans together, we arrive at a more palatable picture of future aggregate money supply growth propensity. (See Figure 9)
Figure 9
Source: nowandfutures.com
And as discussed on these pages before, when the market concludes such a trend has an element of sustainability, market participants will come in and bid gold up. If the chart below is reflecting conditions correctly, then apparently in order for gold to make any meaningful headway from here, global liquidity needs to rise. This view is of course consistent with our discussion above, where the US will lead with an acceleration of M3 growth. You may remember this is what caused gold to take off in the 05/ 06 blow-off coincident to the cessation of M3 reporting. (See Figure 10)
Figure 10
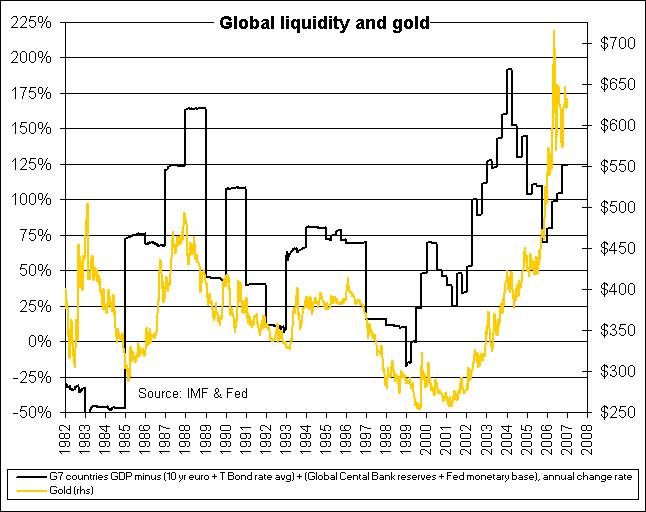
Source: nowandfutures.com
What's more in relation to this potential acceleration in money supply growth then, unhealthy as it may be, the market will of course quickly put two and two together in this respect, with the most important aspect of what is occurring being currency debased beyond repair (coupled with accelerate physical gold investment), which should turn all the important gold related ratios favorable for the bulls. You can readily discern this picture in viewing the chart below that does an effective job of presenting this understanding from a historical perspective, highlighting the secularity of the larger trend currently in favor of hard assets. (See Figure 11).
Figure 11
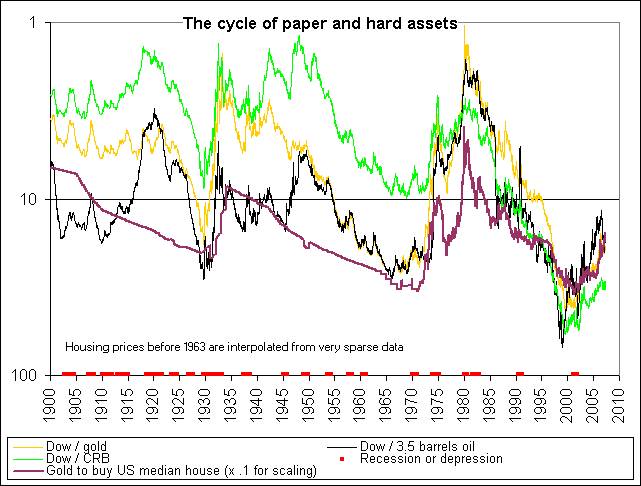
Source: nowandfutures.com
Of course if you have been a precious metals investor over the past year this trend may not be so apparent, but as you can see above, it's still in tact. Moreover, if the trend towards hoarding physical gold continues, along with favorable demand and supply constraints continuing to build for the bullish case, precious metals may finally overcome official efforts to retard price gains. Oh, and please don't kid yourself in this respect, the ECB's announcement the other day does not mean Central Banks are getting out of the gold manipulation game. Nothing could be further from the truth. These characters will attempt managing the gold price both down and up as it suits their needs. Right now, although they don't want it going up as they unleash what they hope is invisible inflation to you, at the same time they do not wish it lower too quickly either, as this could spook people with regard to a deflation scare. Thus, we get the following picture presented effectively by precious metals shares, where the shares lead the sector, and where unless the MACD diamond break is nullified with a break back into this structure, one should not expect any significant price improvements in the sector past more testing indicated below. (See Figure 12)
Figure 12
Further to this, based on the way most precious metals stocks, and especially juniors, have been acting lately (and for some time now generally); again, one would never know we are suppose to be in the midst of a secular bull market. And while some will sight the challenging profit picture as the primary reason precious metals shares are being held back, we know from our studies above that in fact this condition is more a reflection of the gold price having difficulty making progress, not resultant stagnating earnings growth. And it's for this reason precious metals shares are poised to surprise many to the upside at some point, if not before, after the larger equity complex takes a tumble. Here, if we have an event the likes of '87, it won't take people long to figure out monetary authorities will be flooding the system with money by any means. This of course has always been the Fed's reaction under such circumstances. The difference this time around however will be gold's reaction to all this largesse with physical supplies almost spent. Will they be able to keep the genie in the bottle like the other times, or will gold escape its shackles? My bet is it heads higher, and the way things are looking at present it won't take a stock market crash to spark such a move either, so one should be prepared for such a possibilty.
As pointed out previously, and seen here in Figure 4 , in adding the totality of above considerations together, if more recent history is a good indication of what we should expect in a post gold window environment, meaning our current fiat based experiment got rolling for real after Nixon reneged on US bullion related obligations back in ‘71, then cyclical weakness in the complex could last until Christmas, that being 20-months from May of last year, and duplicating the newly unbridled experience witness during the first reaction some 30 years ago. After this, in what we will further categorize as a mid-term correction for gold, where it likes to move in larger three wave affairs with the rest of the commodities complex, it should return to the secular (long-term) trend as it becomes increasingly apparent the USS Titanic is taking on water at an unstoppable rate, and the only way to escape is to abandon ship, that being fiscal America, and the dollar.
We will have more to say on how this sequence is maturing in future commentaries, where it's beginning to look like because of a rapidly weakening US economy, monetary authorities will not be able to back off on support mechanisms to any further appreciable degree during the present mid-term correction, meaning although prices are not moving up impulsively yet, the lows for gold and silver should already be behind us. This is of course why one's fortunes should be well anchored in precious metals at present, and why investors should be more worried about ensuring one has access to a financial lifeboat as opposed to how price managers are rearranging the stock market's deck chairs daily.
Good investing all.
By Captain Hook
http://www.treasurechestsinfo.com/
Special Note: Apologies for the restricted links but there is no way we can open them up just for this article.
Treasure Chests is a market timing service specializing in value-based position trading in the precious metals and equity markets with an orientation geared to identifying intermediate-term swing trading opportunities. Specific opportunities are identified utilizing a combination of fundamental, technical, and inter-market analysis. This style of investing has proven very successful for wealthy and sophisticated investors, as it reduces risk and enhances returns when the methodology is applied effectively. Those interested in discovering more about how the strategies described above can enhance your wealth should visit our web site at Treasure Chests
Disclaimer: The above is a matter of opinion and is not intended as investment advice. Information and analysis above are derived from sources and utilizing methods believed reliable, but we cannot accept responsibility for any trading losses you may incur as a result of this analysis. Comments within the text should not be construed as specific recommendations to buy or sell securities. Individuals should consult with their broker and personal financial advisors before engaging in any trading activities, as we are not registered brokers or advisors. Certain statements included herein may constitute "forward-looking statements" with the meaning of certain securities legislative measures. Such forward-looking statements involve known and unknown risks, uncertainties and other factors that may cause the actual results, performance or achievements of the above mentioned companies, and / or industry results, to be materially different from any future results, performance or achievements expressed or implied by such forward-looking statements. Do your own due diligence.
Copyright © 2007 treasurechests.info Inc. All rights reserved.
Unless otherwise indicated, all materials on these pages are copyrighted by treasurechests.info Inc. No part of these pages, either text or image may be used for any purpose other than personal use. Therefore, reproduction, modification, storage in a retrieval system or retransmission, in any form or by any means, electronic, mechanical or otherwise, for reasons other than personal use, is strictly prohibited without prior written permission.
Captain Hook Archive |
© 2005-2022 http://www.MarketOracle.co.uk - The Market Oracle is a FREE Daily Financial Markets Analysis & Forecasting online publication.