


ETF's Signaling Negative Divergence Cluster Warnings for Markets
Stock-Markets / Financial Markets 2009 Dec 01, 2009 - 10:45 PM GMTBy: Guy_Lerner

 For those of us without a crystal ball, we have to rely upon techniques or signals to get in and out of the markets. These could be moving average crossovers or other more "sophisticated" methods like counting negative divergences, which I have developed and discussed previously. Regardless of what you do, just have a plan. Honor the signals; know where you would get back in if you are wrong.
I have yet to read or hear of one seasoned pro (or otherwise) who knows where this market is going. Even the analysts I respect the most seem to have one foot in and one foot out of this market. We have lots of opinions from lots of smart people, and that is all. So why worry if you get it wrong or sell too early, but I do believe you need to take some action.
So have you sold anything yet?
From my vantage point -that is, from my quantitatively driven research - the clustering of negative divergences bars on the weekly charts of several key ETF's should be a concern if you are an equity bull. Why? If we go back in time, a clustering of negative divergences has often been associated with a market top, but not every market top. The ensuing sell off could be moderate in scope lasting lasting several months or it could mark the onset of a much broader and deeper sell off.
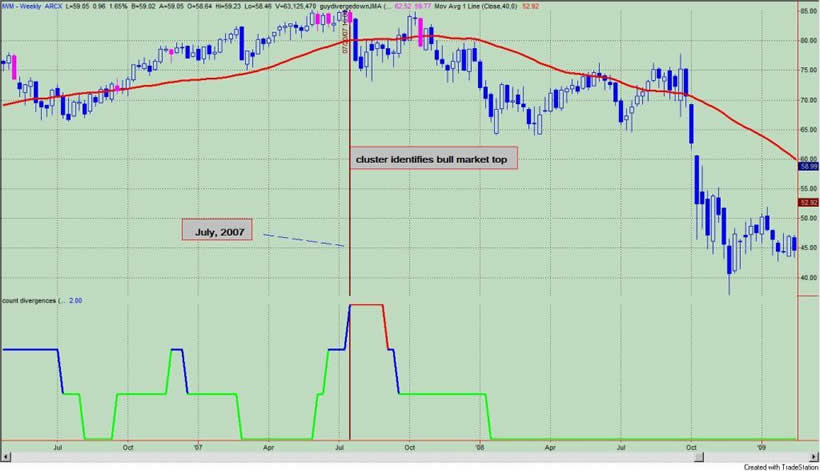
Figure 1 shows the i-Shares Russell 2000 Index ETF (symbol: IWM), and is an example. The indicator that counts negative divergences is in the lower panel, and negative divergences are noted by pink markers on the price bars. This is a look at IWM from July, 2007, and what we note is that this cluster of negative divergence bars signaled the bear market in IWM. Prices have yet to close higher than the negative divergence bars, and at that time, little did we know that this signal would lead to a bear market of epic proportions.
Figure 1. IWM/ weekly (July, 2007)
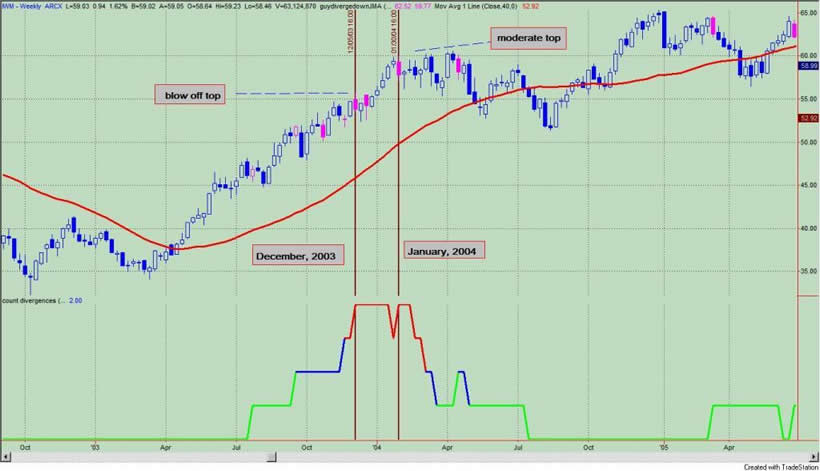
On the other hand, there have been a few times when prices moved higher despite the clustering of negative divergences. When this happened, it appears to represent a blow off top or more rarely (1954 and 1995) part of a sustainable trend. Figure 2 shows the blow off top in IWM that occurred in December, 2003 with a second sell signal in January, 2004 that led to a moderate sell off and buying opportunity several months later.
Figure 2. IWM/ weekly (December, 2003)
Once again, without the use of a crystal ball it is impossible to know what tomorrow or next week will bring. But we can get some clues from the price action.
If price closes over the high of the most recent negative divergence bar (on a weekly closing basis), then the market or ETF (under consideration) in all likelihood is going higher. Whether this represents a blow off top or a more sustainable trend is yet to be determined. If prices remain below these negative divergences, then they do, and you look like a genius for selling. But again, if prices do move higher, you have a mechanism for getting back into the market - a weekly close over the high of the negative divergence bar.
If you sell now and prices do go higher, just look at it as taking out insurance and playing good defense. If you have to buy back later on a close over the negative divergence bar, I would use the low of that bar as a stop loss.
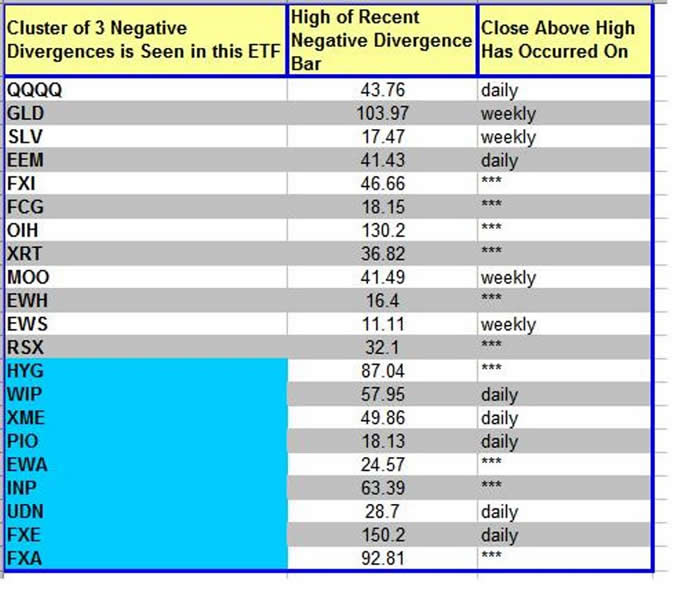
I previously presented this table three weeks ago and these are the ETF's that I follow that have a clustering of negative divergences. Column 1 lists the ETF's by symbol; column 2 is the high of the recent negative divergence bar; column 3 notes a daily or weekly close over the high of the negative divergence bar; if column 3 has asterisks, then prices have yet to close over the highs. If column 1 is shaded in blue, then this is a new addition to the list.
Table 1. ETF's/ negative divergence clusters
Several observations are in order.
1) On the prior list, the QQQQ, GLD, and FXI each had a weekly close above their prior negative divergence highs. Several weeks later, QQQQ and FXI had a weekly close back below the high of their negative divergence bar. After today's (Tuesday's) action, we are back above those highs on the QQQQ only. We await for a Friday close.
2) SLV closed above its negative divergence about 4 days after I wrote the original article, and it has not looked back.
3) The same could be said for MOO, another ETF helped by the falling Dollar.
4) UDN (bet against the Dollar) and FXE (bet on the Euro or against the Dollar) have yet to have that weekly close above the high of the negative divergence bar. They have had a daily close greater than the high of the negative divergence bar.
5) ETF's that benefit from the weak Dollar (EEM, WIP, XME, PIO, QQQQ) have had a daily (not weekly) close greater than their nearby negative divergence high.
The "everything but the Dollar" trade continues. If there is a weekly close above the high of the recent negative divergence bar on the UDN, there is a high likelihood that we could see a blow off top in the equity market. In this year of outlier events, the outlier trade may be realized.
By Guy Lerner
http://thetechnicaltakedotcom.blogspot.com/
Guy M. Lerner, MD is the founder of ARL Advisers, LLC and managing partner of ARL Investment Partners, L.P. Dr. Lerner utilizes a research driven approach to determine those factors which lead to sustainable moves in the markets. He has developed many proprietary tools and trading models in his quest to outperform. Over the past four years, Lerner has shared his innovative approach with the readers of RealMoney.com and TheStreet.com as a featured columnist. He has been a regular guest on the Money Man Radio Show, DEX-TV, routinely published in the some of the most widely-read financial publications and has been a marquee speaker at financial seminars around the world.
© 2009 Copyright Guy Lerner - All Rights Reserved
Disclaimer: The above is a matter of opinion provided for general information purposes only and is not intended as investment advice. Information and analysis above are derived from sources and utilising methods believed to be reliable, but we cannot accept responsibility for any losses you may incur as a result of this analysis. Individuals should consult with their personal financial advisors.
Guy Lerner Archive |
© 2005-2022 http://www.MarketOracle.co.uk - The Market Oracle is a FREE Daily Financial Markets Analysis & Forecasting online publication.