Gold $1,200 Means Defacto Resurrection of the Gold Standard
Commodities / Gold & Silver 2009 Dec 02, 2009 - 12:28 PM GMTBy: Gary_Dorsch
 One-way bets against the US-dollar have been building-up over the past eight-months, and are now estimated to total about $550-billion, in what’s popularly dubbed the US-dollar “carry trade.” Its predecessor, the infamous “yen carry” trade, also gained a lot of notoriety, when the Bank of Japan pegged its interest rates far below those of any other economy on the planet. At its peak in the summer of 2007, the “yen carry” trade grew in size to $1.2-trillion, providing the high-powered octane that pumped-up commodity and stock markets worldwide.
Whereas the “yen carry” trade mushroomed over a period of three-years before reaching its zenith, the “US-dollar carry trade” is on track to eclipse the $1-trillion milestone by mid-2010. In the case of both the US-dollar and yen carry trades, ultra-low borrowing rates, combined with an abundance of liquidity, lured multitudes of speculators into riskier bets in commodities and global stock markets, in search of better returns than is available in ultra-low yielding bonds.
Following the Bank of Japan’s blueprints, the Fed has slashed the federal funds rate to zero percent, and has kept it there since last December. After its meeting in November, the Fed vowed to keep the fed funds rate locked at unusually low levels for an “extended period” of time. The Fed is aiming to artificially inflate the stock market higher, until the illusionary “wealth effect” kicks-in, and US households begin to feel increasingly confident and start spending again.
Stock market investors, who held their nerve and hung onto their shares after the collapse of Lehman Brothers, and subsequent market meltdowns, have enjoyed the biggest rally in decades. The Dow Jones Industrials is up more than 60% from its lows in March, while at the same time, copper, gold, silver, and a broad array of commodities are also zooming higher under the Fed’s reflationary policies.
The strategy of fueling bigger bubbles in order to counter the recessionary effects of bursting bubbles, - peppered with carry trades, moral hazard, and the suppression of interest rates, - is at the core of the Greenspan-Bernanke blueprints to monetary policy. That is to say, when bubbles are inflating, - do nothing, but after they burst, flood the system with paper money to rescue the financial system.
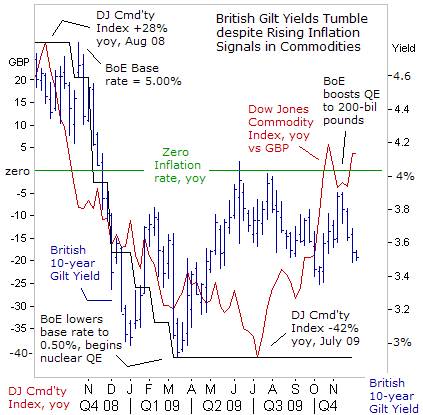 In England and the United States, the Anglo central banks are experimenting a very potent drug, known for its hallucinogenic side-effects, - “Quantitative Easing” that inspires traders to throw all caution to the wind. Bank of England chief Meryn King, and Fed chief Ben “Bubbles” Bernanke are suppressing short and long-term interest rates by flooding the money markets with tidal wave of liquidity. As a result, traders are more willing than ever to participate in speculative bubbles.
On Nov 5th, the Bank of England decided to expand its purchases of gilts to 200-billion pounds from 175-billion pounds, and is monetizing roughly 90% of this year’s budget deficit. The BoE has locked its base lending rate at a record low of 0.50% for eight-months, and has corralled the 10-year British gilt within a narrow range of 3.40% to 4.00-percent. It’s an amazing feat, considering that the UK’s Treasury is auctioning a record 220-billion of new gilts this year.
Gilt traders are dancing to the tune of the BoE, and ignoring signs of rapidly escalating inflation in commodities and the explosive surge in gold prices to above $1,200 /oz. There’s been a swift turnaround for the Dow Jones Commodity Index, after skidding in July, to an annual decline of -42%, before rebounding to +5% higher from a year ago, versus the British pound. For extra insurance, the BoE might print more sterling, in order to steer away from the deflation zone.
Still, the BoE and the Fed have managed to keep the bond vigilantes under sedation, through massive injections of the hallucinogenic QE-drug. Under this scheme, bond yields are anetstitized to inflationary pressures, and immune to the avalanche of new government debt hitting the market. However, at some point, bond holders might regain their senses and realize that they’ve been duped, by lending money at lower interest rates than the “real rate” of inflation.
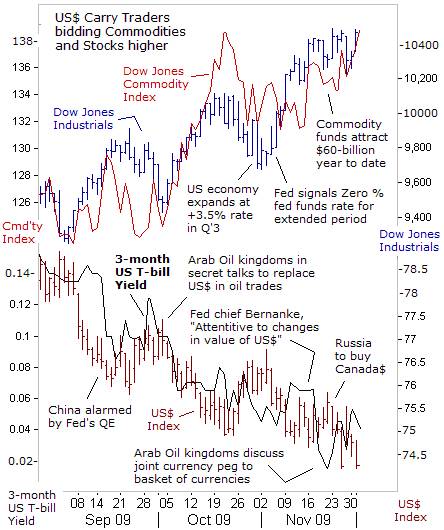 Meanwhile, the Fed is engineering a devaluation of the US-dollar by guiding the Treasury’s 3-month T-bill yield towards zero percent. In turn, speculators are borrowing huge sums of US-dollars and buying higher-yielding foreign currencies, base metals, grains, equities, gold, and silver. And there’s every indication that the “US-dollar carry” trade could get bigger. While there are latent fears of bubbles bursting, – interest rates pegged near zero-percent for longer than is imaginable, is creating conditions for commodities and precious metals to go surprisingly higher.
Ultra-low US interest rates and a weaker US-dollar are also drawing “hot money” into the grain markets, despite the weight of mammoth crops. In October, the USDA forecast an all-time high for the US soybean crop of 3.25-billion bushels, and corn production at 13-billion bushels -- the second largest ever. Yet since then, corn and soybeans have climbed 20% higher, with near zero-percent yields, fueling the US$ carry trade, and whetting the speculative appetite for commodities.
Commodities are on track to attract a record $60-billion this year, already more than the previous record high of $51-billion set in 2006. Total commodity assets under management will probably reach $240-billion by the end of the year, with the largest investments linked to NYMEX crude oil, natural gas, gold and soybeans. Oligarchic banks are beefing-up their commodities staff to take advantage of the upswing in prices and greater risk appetite. Retail traders and swap dealers are also operating in commodities through ETF’s, thus magnifying price volatility.
Bernanke and his band of inflationists are happy to see the high-octane carry trades lifting the commodity and stock markets. “Commodity prices, such as oil have risen lately,” Bernanke noted on Nov 16th, “However, that pickup likely reflects a revival in global economic activity and the recent depreciation of the dollar. But inflation probably will remain subdued for some time. It’s extraordinarily difficult to tell if a bubble is forming. It’s not obvious to me in any case,” he said. His sidekick, Fed deputy Don Kohn admits, “One of the purposes of these policies is to induce investors to shift into riskier and longer-term assets.”
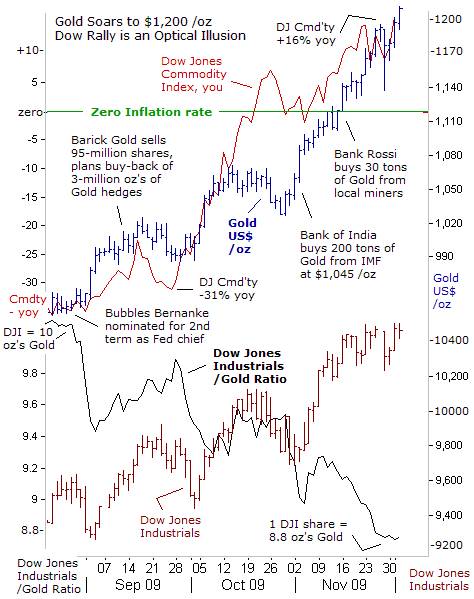
Financial history is marked with times when traders have taken collective leave of their senses and succumbed to the delusions of ever-expanding wealth. Excessive liquidity coupled with visions of new realities allows risks to be downplayed, thereby fueling a massive, largely uncorrected rise in valuations, that discounts not just the present and the near-term, but also a distance far-off into the future.
The parabolic rally in the gold market might in fact, be representing a historic flight from paper currencies of all nationalities, which are becoming increasing worthless. Replacing the paper currency system is resurrection of the Gold standard. That is to say, the proper way to value bond and stock markets, would be through the prism of gold, rather than in the host country’s currency.
For instance, Gold’s recent surge from $975 to $1,200 /oz coincided with a 13% gain in the Dow Jones Industrials. For many, the Dow’s rally above the psychological 10,000 has been perplexing, given the sluggishness of the US economy and the weight of a double-digit jobless rate. The Dow’s “green shoots” rally is the least-loved bull market in history. However, when measured in “hard money” terms, it’s apparent that the Dow Industrials is still trapped in a bear market, since one Dow share is worth only 8.8 oz’s of Gold, or 12% less than 3-months ago.
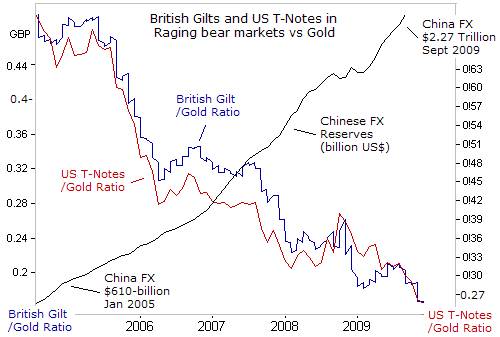
When viewed under the lens of the de-facto gold standard, it’s also clear that British Gilts and US Treasury notes are spiraling lower into a bottomless pit. China’s and Japan’s central banks are the biggest holders of US-bonds, and only hold 2% of their FX stash in gold. They are the biggest losers in this shell game. However, Beijing and the Kremlin are quietly buying gold from state controlled gold miners, while India and Sri Lanka are openly raiding the IMF’s gold stash.
There are also signs of accelerating inflation, with the Dow Jones Commodity Index, +16% higher from a year ago, amid a broad based advance across all sectors, and Philadelphia Fed chief Charles Plosser couldn’t offer anything more than “Jawboning” on Dec 1st. “Increases in interest rates may be appropriate before unemployment or other measures of resource slack have diminished to acceptable levels. Failure to act in this manner risks continuing to inject liquidity into a growing economy at a rate that will create inflation above desirable levels later in the cycle. If this were to happen, the Fed would lose its credibility,” Plosser warned.
Yet Plosser doesn’t have a vote on the FOMC next year, and can only serve as a mouthpiece for the Fed’s propaganda squad. With its hands tied, and its credibility badly shattered, the Fed can only try to brainwash the throngs of new converts piling into Gold, with veiled threats of an early exit from QE, or talk of lifting the fed funds rate above zero percent. But empty threats that are not backed up by action simply evaporate and dissipate into thin air within 24-to-48-hours.
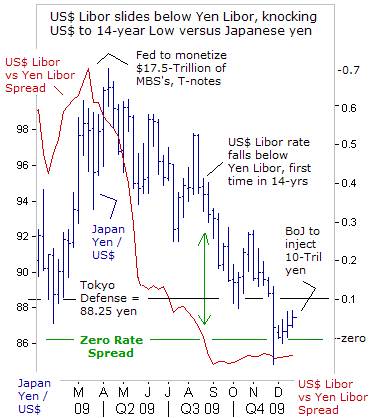 Perhaps the biggest casualty of the US-dollar’s demise is Japan’s Topix and Nikkei-225 index, which are the only losers among the world’s top 40-stock markets this year. The Nikkei-225 index briefly plunged towards the psychological 9,000-level this week, as the dollar’s plunge to a 14-year low of 84.85-yen threatens export earnings and could push the Japanese economy into recession.
For the first time in 14-years, US-dollar Libor borrowing rates fell below Yen Libor rates in August, unraveling of the remnants of the “yen carry” trade, and rendering solo intervention a waste of time. “I am extremely nervous and watching the market carefully,” Japan’s finance chief Hirohisa Fujii told reporters on Nov 27th. “There’s no doubt the market has moved too far in one direction. Moves right now are extreme, and it would be possible to take appropriate measures,” Fujii warned.
Banking Minister Shizuka Kamei asked MoF chief Fujii to request coordinated G-7 intervention. When none was forthcoming, Bank of Japan chief Masaaki Shirakawa warned on Nov 30th the “BOJ will do its utmost to overcome deflation both in terms of monetary easing and insuring the stability of the financial markets.” The next day, the BOJ injected 10-trillion yen ($115-billion) in three-month deposits at 0.1% into the coffers of Japanese banks, to put a floor under the dollar at 86-yen.
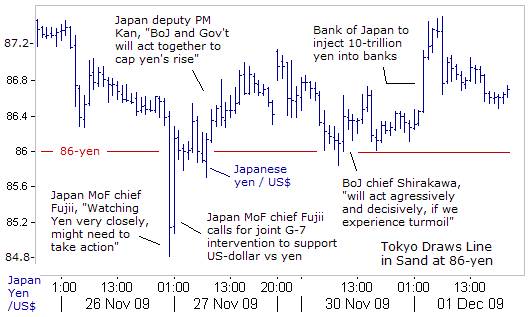
Tokyo’s ability to put a floor under the US-dollar at 86-yen is critical for the calculations of carry traders, who can borrow in yen at 0.1% and reinvest in higher yielding currencies, and global commodity and stock markets, if the risk of a further dollar devaluation against the yen has been greatly minimized or even eliminated. The Fed and US Treasury are happy to hear that Tokyo is re-loading the carry trade with an extra 10-trillion yen of high-octane fuel.
Deputy Prime Minister Naoto Kan says the BoJ’s injections of the powerful QE-drug can support the Japanese economy, and combat it chronic affliction with deflation. According to statistics massaged by government apparatchiks, Japan’s consumer price index was -2.2% lower in October than a year earlier, an eighth monthly drop. The yen’s 11% gain against the US-dollar in the past six months threatens to exacerbate the price slump by driving import costs lower.
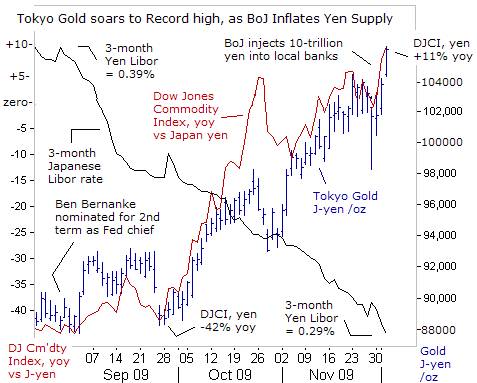
However, Tokyo Gold traders aren’t duped by the government’s propaganda on inflation, and for the first time ever, the yellow metal climbed through the psychological 100,000-yen /oz resistance level. Tokyo Gold dealers are tracking a powerful upward surge in commodity indexes, which now stand +11% higher from a year ago, and is already defusing the threat of a deflationary spiral.
The BoJ succumbed to heavy political pressure, by printing 10-trillion yen this week, helping to catapult the gold market to new heights. Tokyo’s chieftains are addicted to the QE-drug since Japan’s public finances are in much worse shape than Washington’s. Whereas the US-public debt will hit 93% of gross domestic product next year, according to the IMF, by sharp contrast, the IMF says Japan’s public debt could reach 227% of GDP in 2010 -- greater than the combined annual economic output of Germany, France, Britain and Canada.
The collapse of Bear Stearns, Lehman Brothers, and AIG is already becoming a distant memory, and Dubai’s debt problems only caused a one-day ripple, proving that the QE-drug is the magic potion that heals all wounds. However, one of the side-effects of overdosing on QE is the resurrection of the de-facto Gold standard, usurping the role of the US-dollar in pricing the world’s markets.
This article is just the Tip of the Iceberg of what’s available in the Global Money Trends newsletter. Subscribe to the Global Money Trends newsletter, for insightful analysis and predictions of (1) top stock markets around the world, (2) Commodities such as crude oil, copper, gold, silver, and grains, (3) Foreign currencies (4) Libor interest rates and global bond markets (5) Central banker "Jawboning" and Intervention techniques that move markets.
By Gary Dorsch,
Editor, Global Money Trends newsletter
http://www.sirchartsalot.com
GMT filters important news and information into (1) bullet-point, easy to understand analysis, (2) featuring "Inter-Market Technical Analysis" that visually displays the dynamic inter-relationships between foreign currencies, commodities, interest rates and the stock markets from a dozen key countries around the world. Also included are (3) charts of key economic statistics of foreign countries that move markets.
Subscribers can also listen to bi-weekly Audio Broadcasts, with the latest news on global markets, and view our updated model portfolio 2008. To order a subscription to Global Money Trends, click on the hyperlink below, http://www.sirchartsalot.com/newsletters.php or call toll free to order, Sunday thru Thursday, 8 am to 9 pm EST, and on Friday 8 am to 5 pm, at 866-553-1007. Outside the call 561-367-1007.
Mr Dorsch worked on the trading floor of the Chicago Mercantile Exchange for nine years as the chief Financial Futures Analyst for three clearing firms, Oppenheimer Rouse Futures Inc, GH Miller and Company, and a commodity fund at the LNS Financial Group.
As a transactional broker for Charles Schwab's Global Investment Services department, Mr Dorsch handled thousands of customer trades in 45 stock exchanges around the world, including Australia, Canada, Japan, Hong Kong, the Euro zone, London, Toronto, South Africa, Mexico, and New Zealand, and Canadian oil trusts, ADR's and Exchange Traded Funds.
He wrote a weekly newsletter from 2000 thru September 2005 called, "Foreign Currency Trends" for Charles Schwab's Global Investment department, featuring inter-market technical analysis, to understand the dynamic inter-relationships between the foreign exchange, global bond and stock markets, and key industrial commodities.
Copyright © 2005-2009 SirChartsAlot, Inc. All rights reserved.
Disclaimer: SirChartsAlot.com's analysis and insights are based upon data gathered by it from various sources believed to be reliable, complete and accurate. However, no guarantee is made by SirChartsAlot.com as to the reliability, completeness and accuracy of the data so analyzed. SirChartsAlot.com is in the business of gathering information, analyzing it and disseminating the analysis for informational and educational purposes only. SirChartsAlot.com attempts to analyze trends, not make recommendations. All statements and expressions are the opinion of SirChartsAlot.com and are not meant to be investment advice or solicitation or recommendation to establish market positions. Our opinions are subject to change without notice. SirChartsAlot.com strongly advises readers to conduct thorough research relevant to decisions and verify facts from various independent sources.
Gary Dorsch Archive |
© 2005-2022 http://www.MarketOracle.co.uk - The Market Oracle is a FREE Daily Financial Markets Analysis & Forecasting online publication.


