What Can Tell You if Stock Market Risk Levels Are Increasing?
Stock-Markets / Risk Analysis Dec 03, 2009 - 02:16 PM GMTBy: Marty_Chenard
Imagine this ... John is hiking up a 5 mile mountain. After each mile hiked, he notices that he is tiring and that he needs more time to rest.
He just finished his third mile, and he is starting the next mile with less energy ... but he still has energy left. The reality is that with each additional mile hiked, his energy is lessening.
Questions ...
1. Will John be able to reach the top and climb all 5 miles?
2. Will his dropping energy lead to fatigue and a retreat before the top?
3. Are the odds increasing or decreasing for him to make it to the top?
Why all these questions and why do they relate to the market now?
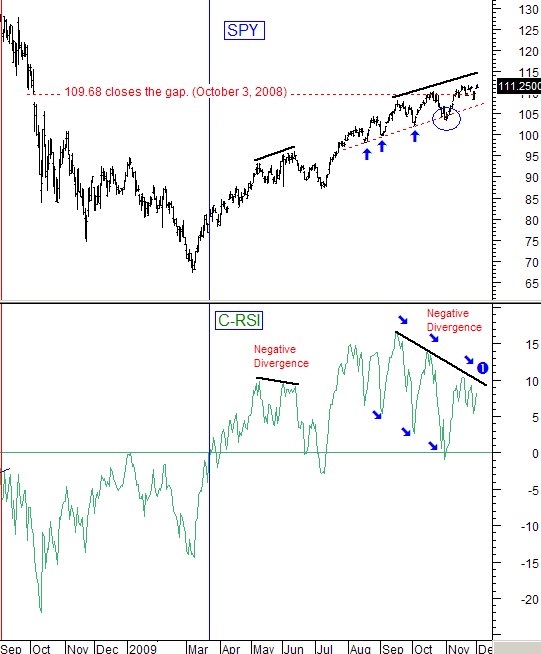
It is because the analogy fits today's chart shown below. The picture of the progress on the trip "up the mountain" is depicted by the SPY's upward price movement on the chart.
The C-RSI (Relative Strength) depicts the decreasing amount of strength as each new mile is climbed. The amount of strength is still positive ... but it is continuing to decrease, so the odds are getting worse for each new mile (each new high) being attempted.
What message is this sending? That each new high is becoming more difficult, and that corresponding risk levels for investors are increasing.
What would it take for an energy (strength) rejuvenation for the upside to occur? The C-RSI would need to break above its black resistance line at label 1 on the chart.
(For an in-depth explanation of the C-RSI, please click on this link: "The C-RSI explained"

** Feel free to share this page with others by using the "Send this Page to a Friend" link below.
By Marty Chenard
http://www.stocktiming.com/
Please Note: We do not issue Buy or Sell timing recommendations on these Free daily update pages . I hope you understand, that in fairness, our Buy/Sell recommendations and advanced market Models are only available to our paid subscribers on a password required basis. Membership information
Marty Chenard is the Author and Teacher of two Seminar Courses on "Advanced Technical Analysis Investing", Mr. Chenard has been investing for over 30 years. In 2001 when the NASDAQ dropped 24.5%, his personal investment performance for the year was a gain of 57.428%. He is an Advanced Stock Market Technical Analyst that has developed his own proprietary analytical tools. As a result, he was out of the market two weeks before the 1987 Crash in the most recent Bear Market he faxed his Members in March 2000 telling them all to SELL. He is an advanced technical analyst and not an investment advisor, nor a securities broker.
Marty Chenard Archive |
© 2005-2022 http://www.MarketOracle.co.uk - The Market Oracle is a FREE Daily Financial Markets Analysis & Forecasting online publication.


