Nasdaq NDX Stock Index Futures Technical Study
Stock-Markets / Stock Index Trading Dec 05, 2009 - 02:51 PM GMTBy: Piazzi
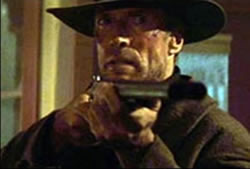
 I was lucky in the order, but I've always been lucky when it comes to killin' folks – Character of William Munny, as played by Clint Eastwood, in the Movie Unforgiven
 This is a 5-min chart of NDX minis from 8:44 to 11:44 am
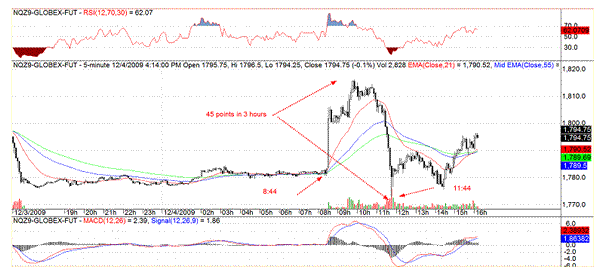
How does one survive a 3-hour hack job like that? The answer is simple: One does not! I mean unless one is lucky, or a genius trader, or in control of the market, or has no interest in short term trading.
Stepping a bit back, using a 60-min chart, things show a bit more sense and sensibility
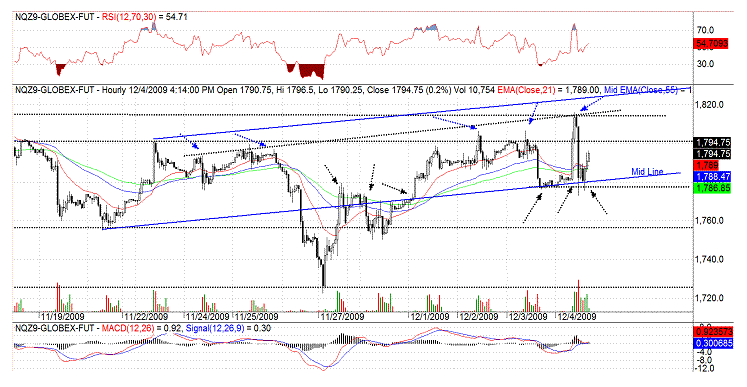
Notice the mid-line starting at the low of November 20. It acted as resistance area a number of times and then became support, and that support held firm during the crazy hours of Thursday and Friday.
One technical characteristic of mid-lines and mid-ranges is that when they fail, price has often a tendency to swing towards the other end of the range -- action/reaction?
On November 30, price zoomed down through the mid range. But it stabilized soon, and ran back up and went upside through the mid-line. When the a bearish setup is reversed ,soon after the setup is established, one needs to examine a bullish outcome and take a hard look at any position established in line with the bearish setup.
Further on, notice the parallels I have drawn from the peaks of November 23, and 24. The one from November 24 has capped the price on all spikes.
It’s an old techniques. It’s simple and sometimes effective. Will the mid-line and parallels of the above chart hold forever? Of course not, but the mid-line was under serious attack on Thursday and Friday. It should hold. If it cannot, then, I would not be holding a short term long position backed only by prayers and not much else.
If I wanted to extend the same technique and get some sense of support further below, I could draw lines like I have in red on the chart below
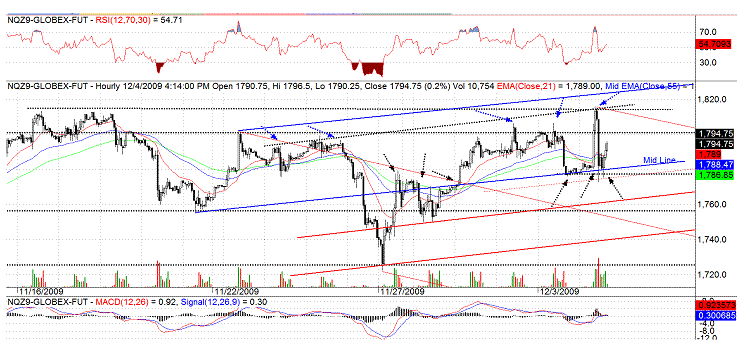
I can still expand my study and apply more range study techniques
Notice On the chart below that I have boxed the two recent drops from November 11, and 25 (pink and purple boxes)
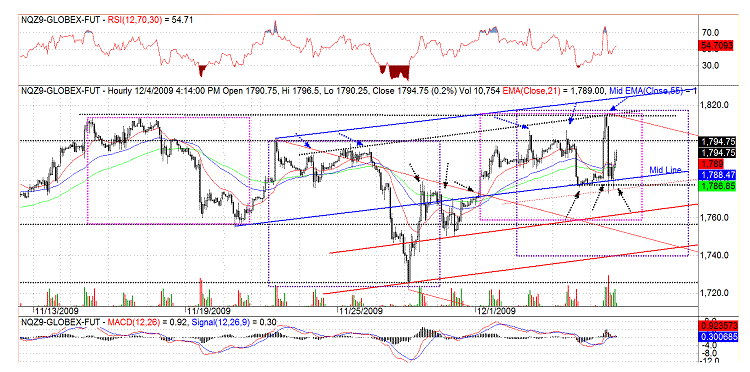
Now, if I project the boxed onto the top of the Friday spike, the bottom of the boxes, hit the areas of the two parallel read line support s that I have drawn.
So, on Monday, and Tuesday, if things unravel, and bears finally get their wishes, the above is a chart that I will use as a backdrop to price action.
Of course, bears need to do more than just wishing, they need to short and withstand squeezes. If they can’t, and market drags on, up through the week, then the above picture may change and new studies may be needed to identify new areas of interest.
That is the tricky part of short term trading. On a weekly chart, a technical study may last for a long time. On a 60-min chart, one may need to re-evaluate daily if not more frequently. On a 5-min chart, you are in no-man’s land.
In Clint Eastwood’s unparalleled masterpiece of a western, Unforgiven, near the end, the character of William Munny goes on shooting down many of his opponents and scaring the rest.
After it’s all settled down, one pacifist writer of a character asks him how he chose whom to shoot first because, when confronted by superior numbers, an experienced gunfighter would always fire on the best shot first.
Now that is how a writer who has never had a gun sees it, trying to rationalize and find a sense of order.
The real gunman who has just killed so many and scared the rest sees it quite differently. He says:
“I was lucky in the order, but I've always been lucky when it comes to killin' folks“
So, on a 5-min chart, good luck, and good stops, ‘cause you gonna need’em
PS. My special thanks to my colleague Joe K for getting me interested in mid-line studies
By Piazzi
http://markettime.blogspot.com/
I am a self taught market participant with more than 12 years of managing my own money. My main approach is to study macro level conditions affecting the markets, and then use technical analysis to either find opportunities or stay out of trouble. Staying out of trouble (a.k.a Loss) is more important to me than making profits. In addition to my self studies of the markets, I have studied Objective Elliott Wave (OEW) under tutorship of Tony Caldaro.
© 2009 Copyright Piazzi - All Rights Reserved Disclaimer: The above is a matter of opinion provided for general information purposes only and is not intended as investment advice. Information and analysis above are derived from sources and utilising methods believed to be reliable, but we cannot accept responsibility for any losses you may incur as a result of this analysis. Individuals should consult with their personal financial advisors.
© 2005-2022 http://www.MarketOracle.co.uk - The Market Oracle is a FREE Daily Financial Markets Analysis & Forecasting online publication.


