


Gold Minor Pullback or a Major Correction?
Commodities / Gold & Silver 2009 Dec 08, 2009 - 10:23 AM GMTBy: Mark_Brown

 Donald W. Pendergast writes: Wow – what a week it was in the world of Gold! After charging above $1,200 on the front-month futures contract earlier in the week, Gold finally finished the week on a very weak note, closing below $1,150, which was right above the low established a week earlier in the wake of the Dubai debt debacle. Clearly, Gold is beginning a trend reversal on a daily-based time frame, but the technical picture is less clear over the long-term. Let’s examine a weekly chart for GLD (one of the financial instruments that holds actual Gold) to get a better fix on what might be expected in this volatile market over the next month or so.
GLD ETF Trading
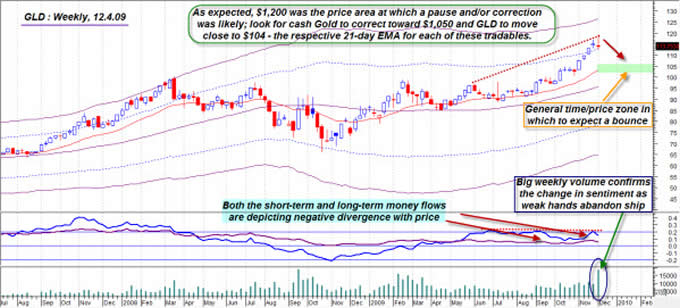
Graphic credit: Metastock v.11
Before going any further, I must admit to being a Gold Bug, having been afflicted with this wonderful malady for many years – including the time period prior to the recent bull run in Gold from 2001-present. Long-term, and given the abysmal long-term outlook for the US Dollar (and all fiat currencies for that matter), declining mine production (most of the high-quality, easier to mine deposits are used up already) and greater awareness among investors regarding the inclusion of Gold in their portfolios, I believe that Gold will easily make it to $2,500 to $3,000 at some point in the next five years, despite several massive sell-offs along the way to the eventual summit. However, in the here and now, we need to also rely on our charts, technical indicators and COT futures market data (Commitment of Traders report, published weekly by the CFTC) in order to minimize losses and maximize gains by waiting for more opportune times to add to long-term holdings of Gold and/or to capitalize on high probability, short-term moves (up and down) that will likely commence from solid support/resistance (S/R) levels in the weeks ahead.
OK, now on to what the weekly chart of GLD is telegraphing to astute traders and investors here:
1. $1,200 was a key Fibonacci extension/Keltner Band resistance area on both a weekly and monthly time frame; major turbulence was expected well in advance – thus the recent tumble came as no surprise to experienced technical traders.
2. Note this week’s wide-range weekly reversal candle, one that printed on extremely heavy volume (see circle at bottom of chart); this is a major reversal signal, especially for daily-based traders, coming in the wake of such a high profile resistance barrier($1,200).
3. Look now at the short-term and long-term money flows (lower portion of the chart); both of the Chaikin money flow indicators (CMF)(34) and (CMF)(144) are revealing pronounced negative divergences with the actual price trends of GLD, which means that the raw fuel (money flowing into GLD and Gold) needed to drive Gold higher is beginning to dry up – for the time being.
OK, so what? What’s a trader and/or investor to do now, given this information? Well, if you’re a long-term Gold Bug, simply hold your core investment positions for the long-haul; that $100+ trillion US national debt/unfunded liability problem ain’t paid off just yet (and likely will never be), so the future for Gold has never looked better, especially for those wishing to diversify out of the Greenback. Let this corrective move play out and trhen consider adding more at lower price levels – $1,050 might be one such a price zone, which happens to be the current 21-week exponential moving average (EMA) price for cash Gold.
For those investing via shares in GLD, the area near $104 also coincides with its own 21-week EMA. More cautious investors might wait for a move lower toward the 50-week EMA, which comes in at about $96 for GLD and $975 for cash Gold. The 21- and 50-week EMA’s acts as strong S/R barriers in nearly every kind of market, and Gold is no exception, so you may wish to do further analysis to see if adding on at those particular price areas makes sense for your financial situation.
Traders can be a bit more aggressive; expect to see some sort of a reaction move higher once GLD/Gold hit their 21-week EMA (green box on the chart shows the likely time/price zone in which to anticipate a reversal higher)– this will most likely be a high-probability swing trade play, one that also needs to have a logical stop loss and profit target as well. Daily-based traders can do the same thing – plan on on the 21-day EMA offering some sort of a floor from which a short-term tradable bounce will commence. But be very nimble, with firm stop-loss and profit targets in place before you enter the trade.
Yes, this is a real correction in Gold, but no one really knows how far the price might fall. Even the strongest bull markets need to pause and correct before moving higher, and perhaps this is the case with the Gold market right now. We should know more as the weeks ahead play out; as always, use common sense, be patient and learn to focus on what the charts and long-term fundamental factors are saying, rather than giving in to fear, doubt or the opinions of those who may not have your best interests in mind.
By Donald W. Pendergast Jr.
To receive more information on trading ETF funds visit my website: www.ETFTradingPartner.com
Mark Brown is an independent trader who focuses on trading ETF funds. He has been involved in markets and money management since 1998. His unique trading model which uses a combination of analysis like: economy, market cycles, chart patterns, volume, market internals, and money management. Visit his site: ETF Trading Partner www.ETFTradingPartner.com
© 2009 Copyright Mark Brown - All Rights Reserved Disclaimer: The above is a matter of opinion provided for general information purposes only and is not intended as investment advice. Information and analysis above are derived from sources and utilising methods believed to be reliable, but we cannot accept responsibility for any losses you may incur as a result of this analysis. Individuals should consult with their personal financial advisors.
© 2005-2022 http://www.MarketOracle.co.uk - The Market Oracle is a FREE Daily Financial Markets Analysis & Forecasting online publication.