Gold and Crude Oil Seasonal Analysis
Commodities / Seasonal Trends Dec 11, 2009 - 08:23 AM GMTBy: John_Winston
 Over the course of the past three months, gold has taken the lead from the crude oil market is a normal autumn seasonal pattern. Granted, Oil held up longer than usual and gold rallied longer, but the seasonal trends are still playing.
Let's look at the gold market first, as it has been front and center. A lot of investors shun gold but a hard look at the commodity market shows that it is one of the lesser volatile commodities. As far as a bubble goes, gold is nowhere near the price appreciations seen in other commodities like copper, sugar, cocoa, orange juice and a host of others.

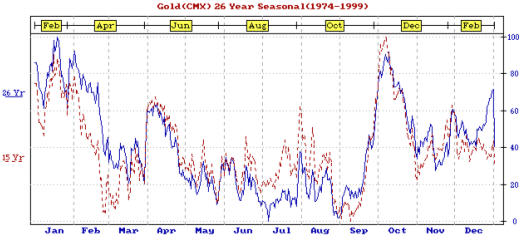
We can see that price highs are made in the Jan/February time frame on average, but in bull market legs, have been known to extend into the spring. The gold chart below shows that the mid February timeframe established the winter high, made a temporary low at the beginning of May and a secondary low in the July time frame.
On the other end of the spectrum, the September thru December time period is usually where the best appreciation is witnessed. For the most part, this is how gold behaved this year with the exception that the end of September and early November lows were only mild corrections as the bull leg was strong enough to make these seasonal pullbacks just dips on the chart.
In my August 19th commentary (you can Google it - John Winston gold/oil/copper), I made a case for a bull market rally in gold and targeted the ideal time to begin would be September. Two weeks after that update, gold launched into its best run in quite a while and has become a headline item even in the mainstream press. But what is the outlook going forward ?
Gold has now reached a timeframe where a December pullback is in effect. If things play out a temporary bottom should be seen in mid December or early January and another gold leg up would develop into the early winter. That has been the norm of late. Over the past three years, February has been a pivotal month for price peaks in gold. The seasonal chart above shows that January/February price highs can be important. The stronger the rally, the longer the seasonal extends. The 2007 price peak did not come until the month of May, exceeding the February price peak.
So where are we now in the rally?
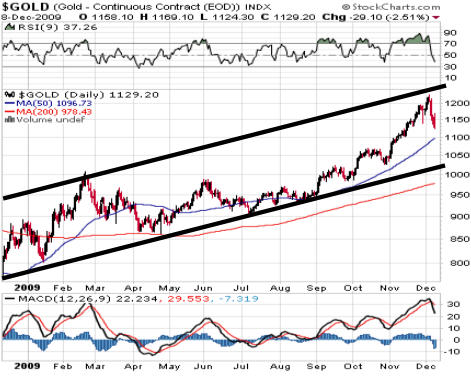
First off we can see that the fall rally began right on time at the very beginning of September. We entered the September timeframe with gold just below the 950 area. Seasonal pullbacks occurred at months end in September and October. But the beginning of November bought on a major escalation in price once the 1070 area was taken out on the upside. Here's what I had to say in our August 19th report regarding gold:
"Moves above the 975-985 area would greatly favor an upside breakout and moves above the 1075-1100 would be indicative that the next leg of the gold market has begun."

From a price perspective gold has support at the 1100 dollar area (plus or minus 25 dollars) and at the bottom of our price channel at the 980-1050 area. All technical indicators confirm of gold's pullback and if the seasonal tendencies continue to play out, gold should provide one more rally as we work our way into the winter months. The 50 day moving average has not been touched since late August and is due for a visit. This is where we get our first number of 1100 (plus or minus 20 dollars).
The lower black channel line is another area of interest on this chart. It has provided price support in each pullback during the 2009 season and is another area where a potential low might develop. We can see it provided the lows in May, July, Aug, and September. This confirms the importance of this channel line. Just under that channel is the 200 day moving average, a level that provided major support during the April timeframe this year. It currently stands at the 979 area. Coincidentally, it was near this area that the latest leg of this rally began. While that area seems far away we need to keep in mind that the current gold rally began over 13 months ago at the $680 price level. A medium term correction after a $540 dollar move wound be a reasonable expectation as well.
There are a few ways one could play it. First, if your short term oriented or looking for a spot to hop on board, the first area we mentioned, the 1075-1125 area (ideally the 50 day moving average) offers a potential opportunity for gold's price to turn and would be ideal for a short term play and as it turns out, would put price right near the middle of the channel lines. For those looking to enter, one option is to take the first nibble at this first price area, and a secondary position could be taken should gold make it to the bottom of the channel line near the 1000 area. This would give gold two key areas to bottom in and would be less of a risk using this scale in method for new entrants who have been eager to participate.
The second area of interest is the 200 day moving average and the lower black price channel line on the gold chart above. If we add a plus or minus $25 dollars to this area, we would come up with the 950-1000 area where a potential gold bottom could form. Using the example above, this is where one might contemplate a secondary position.
From a technical perspective both of the areas we've mentioned is an important price point on the chart using various methods of calculations for price retracement and support areas. If one is trying to build an entry plan into this market the above EXAMPLE is an excellent way for one to plan and execute a simple entry strategy that has more than one entry point as part of the overall plan. I am not advocating you use the above example, but that you have a plan of your own rather than just enter anywhere on an emotional whim.
In order to be successful in the markets there is really only two things one needs to know. How to enter a market and when to exit one is the bottom line when the scores are tallied. If you have an entry plan, and an exit strategy, your chances of success will be much greater.
Gold Outlook
The 13 month old bull market in gold has an incredible $540 dollar run behind it a short time. This is significant when you consider that for all of history, gold was under $700 at one point last October. The best part of the seasonal run on average is behind us. But that is on average. In bull markets, gold has the tendency to run higher in the mid winter to early spring timeframe. The bullish fundamentals and news of nations and central banks buying gold, the short supply in the physical markets, the rumors of physical shortages at the exchanges, the debasement of paper currencies via the printing press, and the "LOSS OF CONFIDENCE" in world government provides a powerful incentive for potential price increases in gold.
What could derail the train?
It seems there is only one thing that has been able to affect the price of gold to the downside and that is the potential of a mass debt default. This observation is based solely on the fact that the 2008 global meltdown had a direct impact to the price of gold and so far, it seems that the Dubai situation has also coincided with a downdraft. That is not to say that investors wouldn't flock to gold this time either. They very well might. Suffice to say that should further escalation begin to surface in the debt area, one should be aware of the potential implications for gold. On the bullish side, one can say this. Gold has been the only major financial instrument to make NEW highs since the last debt default.
On the upside..........
From a pure chart perspective in this report, the upper channel line on the gold chart at the 1250 area is an area where we should expect a significant resistance area. Should all the bullish fundamentals come into play and the perfect storm develops for gold, then the breakout above the 1250 area will be even more powerful than the one we saw when gold broke above the 1070 area recently and should provide another leg up into mid winter and or early spring.
On the downside...........
We've already pointed out the two key areas to watch (near the 50 and 200 day averages and the upper and lower black channel lines on the chart). Odds would favor that one of these two areas will provide a meaningful or at least a trading bottom for gold. A rally back up from the 50 day moving average that fails to exceed the upper black channel line at the 1250 area would leave the door open for more consolidation in gold's price over the coming month. Failures at the 50 day average might provide impetus for a test of the lower boundaries of the channel.
The bottom line...........
From a seasonal standpoint, odds favor one more push up into mid winter. We feel the key area to watch price action is at the upper end of this channel line. A failure to move above the upper black channel line would provide the peak for this current leg and a correction into the spring would unfold. A move above this line would suggest the next bull move is underway and would prolong the gold rally into a later timeframe in 2010. We feel that the 1250-1325 is the most important price area over the next few months. Short termers should pay attention to the 50 day and longer term investors at the 200 day average and the lower black channel line. For seasonal players, some profits out of GOLD and INTO CRUDE OIL during the FEB/March timeframe is usually the ideal time for crude to take over the lead in price appreciation. And with that said, let's look at the crude oil market.
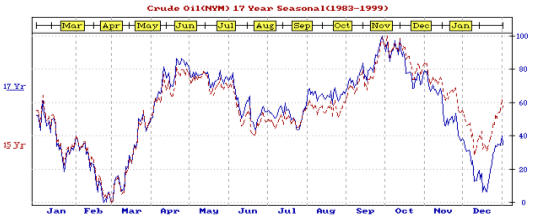
In the seasonal chart below, we can see that the main area where crude oil usually bottoms is the FEB/MARCH time frame on Average. I suspect that all the calls for $100 dollar oil over the past few months has been temporarily delayed due to the seasonal tendencies of the crude oil market. Indeed, the current downdraft is playing right along with these aspects. We can see that coming up, there usually is a slight bounce in December to January, and from there, a major low into late winter. In a bull market, crude can and does sometimes bottom in December and the pullback in winter can at times provide a higher low. Purchases at the seasonal bottom have two key liquidation times on average, April/June and/or October/November.
The weakest part of the cycle as we can see is the October thru February timeframe, a timeframe we have now entered. (months are below this chart...contract month above.)

In the Crude oil market, the seasonal tendencies are much more pronounced and to some extent, the timeframes are more consistent.
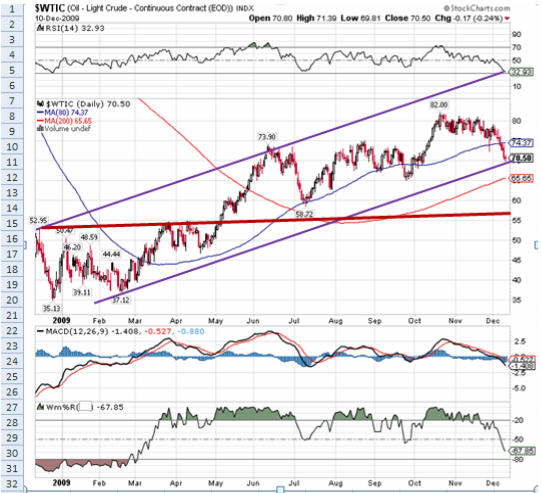
The chart below of crude shows some interesting seasonal highlights from last year. First and most important is the seasonal low in December, the January bounce, and the final low at the end of February and beginning of March. This was a perfect seasonal move. From there an April move began to pullback, but the bullish action ran it higher into June and crude peaked very late. The seasonal chart calling for a July low was a very short 4 to 6 week affair. However, it did produce the seasonal July low right on time. From that point we rallied right to the end of October and peaked at the 82 dollar area right on the seasonal date for a turn. Since then we have dropped all the way to the 69 dollar area.
The end of December approaches and an initial low is due soon in crude. A look at the chart shows the 65-70 dollar area is a key spot where the 200 day moving average and the current daily trend channel lie. On the technical side, RSI is near the oversold area, and Williams %R is nearing that area as well. A longer term support area is the fat red line just above the 55 area on the chart. Odds suggest that a rally attempt should develop from this 65-70 dollar area. SHOULD OIL MOVE BELOW the 200 day average at$ 65, then the potential for a move below 60 towards the red support line will be a potential area for a late winter bottom.
Look for December or March to provide the lows in crude. March is a great time to trim a few gold profits and funnel them into the crude oil market.

These are interesting times for commodity investors and it is important to be looking at all aspects of the markets. Seasonals are so often overlooked, yet they provide a guideline for what to expect and when to expect it. At our website, we are following the seasonal trends of gold and oil always analyzing the price charts looking for low risk set-up trades and/or entries for our subscribers. We invite you to visit our site and have a look.
If you would like to receive Free Gold Analysis please visit my site: www.TechnicalCommodityTrader.com
By John Winston
John Winston is the technical commodity trader analyst. He provides detailed technical analysis for popular commodities like gold, silver, copper, oil, and natural gas. By focusing strictly on these commodity price movements trading become strictly technical and simple to trade. His free trading reports are available at his website: www.TechnicalCommodityTrader.com
Contact John at: Info [@] TechnicalCommodityTrader.com
© Copyright John Winston 2009
Disclaimer: The above is a matter of opinion provided for general information purposes only and is not intended as investment advice. Information and analysis above are derived from sources and utilising methods believed to be reliable, but we cannot accept responsibility for any losses you may incur as a result of this analysis. Individuals should consult with their personal financial advisors.
© 2005-2022 http://www.MarketOracle.co.uk - The Market Oracle is a FREE Daily Financial Markets Analysis & Forecasting online publication.


