


Stock Bullish Trend Turning Sideways
Stock-Markets / Stock Index Trading Dec 13, 2009 - 12:47 PM GMTBy: Peter_Navarro

 Last week, market action was decidedly mixed. The Dow Jones industrial average and the S&P 500 were barely up while both the NASDAQ and the Russell 2000 were down. Most troubling is the lack of volume -- the persistent trend over the last month in what may be an aging bull market.
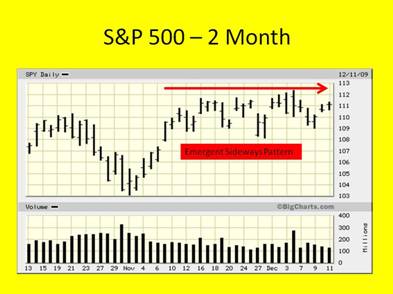
In fact, there is an emergent sideways pattern to major US stock market indices that is well worth noting as we stumble towards the end of the year. This pattern is evident in the two-month chart of the S&P 500. Since November 13, this broad market index has basically gone nowhere.
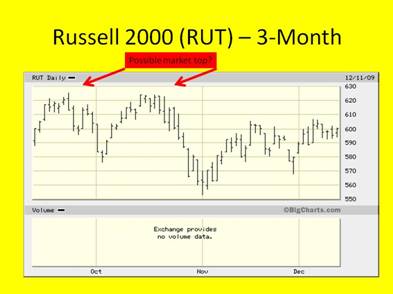
The chart of the Russell 2000 is even more interesting. It suggests that a market top may have been reached as early as the middle of October. At best, this chart evinces a sideways pattern as well.
These observations are consistent with the ongoing technical weakness that I have been noting now for almost a month in this newsletter. While sentiment is neutral, both momentum and strength measures suggest a bearish trend reversal.
Both the emergent sideways pattern and the ongoing technical deterioration in the market are a reflection of mixed macro fundamentals. While there is continuing evidence of recovery in the business investment component of the GDP equation, the consumer remains a question mark. More broadly, all forecasts point to a meek recovery in 2010 it that is unlikely to significantly reduce the unemployment rate -- or generate robust corporate earnings.
From a trading perspective, the safest strategy, particularly as we move into the holidays and the end of the year, is simply to move into cash, count your blessings, and conduct research that will position you for some more active trading in the new year when the trend hopefully declares itself more fully -- either bullish or bearish. If, however, you want to continue to trade this market, you may want to consider a long-short approach such as the one I discussed several weeks ago in highlighting a strategy to trade the IBD 100. (Click here to review)
The least risky type of a long-short strategy is to find two stocks in the same sector or space -- one that is weak that you can short sell and one that is stronger to go long with. This is called a "pair trade." An excellent case in point is offered up in this week's edition of Barron's magazine.
In an interview with Douglas A. Kass, the President and founder of Seabreeze Partners Management, Kass recommends the following pair trade: Short Franklin Resources (BEN) while going long State Street (STT). In general, I like this trade but only with a properly timed entry using technical analysis.
In fact, right now, technical analysis would suggest that Douglas A. Kass is dead wrong. In particular, Market Edge rates Franklin Resources a "buy" while rating State Street a short sell. This is exactly the opposite recommendation of Douglas Kass. Thus, if you were to execute this particular pair trade right now you would be very early to the game, at least on the basis of technical analysis.
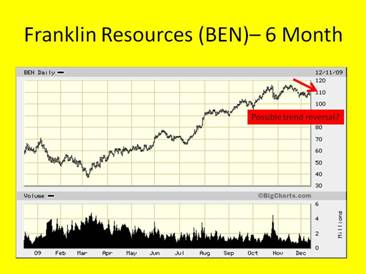
That said, I do like this trade possibly over the long term. Looking at the one-year chart of Franklin Resources, you can see a double top pattern that suggests a possible trend reversal. Based on this chart pattern, being early into this trade on the short side may not be that risky.
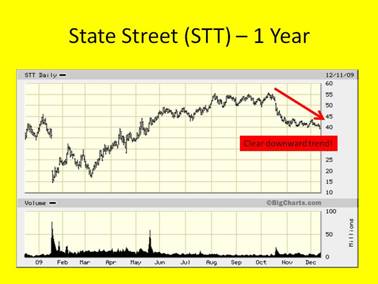
On the other hand, the one-year chart of State Street clearly indicates the beginning of a strong downward trend in the stock in mid-October. Thus, going long State Street right now would be much more of a leap of faith.
My bottom line here is that this is a good pair trade to put on your watch list. If Kass is right, the technical indicators will begin to point in the right direction and greenlight this trade. It could be big.
To end this missive, I'd like to leave you with a quote from the Kass interview that is consistent with my broad view of the market and my concern that a bearish trend reversal may be on the horizon:
"Frankly, it's hard to totally understand what has been propelling the recent market rise, both in scope and persistence. An obvious reason is the Fed's zero-interest-rate policy and its cheap-dollar initiative, which is creating a shortage of available credit domestically and a glut overseas. And while gold and equities rise, this is undercutting domestic economic growth. In a vicious cycle, capital is being deployed away from the US, small businesses and the consumer, and it's pushing our dollars abroad and wasting precious growth capital and assets in commodity bubbles. And renewed optimism in longer-duration assets such as stocks has, in part, resulted in a massive reallocation at large domestic pension plans and endowments. They have moved from fixed income to equities after allowing the ratio of bonds to stocks to rise dramatically by the time the US stock market hit the bottom in March of this year.
Professor Navarro’s articles have appeared in a wide range of publications, from Business Week, the Los Angeles Times, New York Times and Wall Street Journal to the Harvard Business Review, the MIT Sloan Management Review, and the Journal of Business. His free weekly newsletter is published at www.PeterNavarro.com.
© 2009 Copyright Peter Navarro - All Rights Reserved
Disclaimer: The above is a matter of opinion provided for general information purposes only and is not intended as investment advice. Information and analysis above are derived from sources and utilising methods believed to be reliable, but we cannot accept responsibility for any losses you may incur as a result of this analysis. Individuals should consult with their personal financial advisors.
© 2005-2022 http://www.MarketOracle.co.uk - The Market Oracle is a FREE Daily Financial Markets Analysis & Forecasting online publication.