Could the Fed Hike U.S. Interest Rates Sooner than Expected?
Interest-Rates / US Interest Rates Dec 16, 2009 - 11:12 AM GMTBy: Gary_Dorsch
 One more Dance before Midnight Strikes, “As the old saying goes, what the wise man does at the beginning, fools do in the end,” said Warren Buffett, at Berkshire Hathaway’s Annual Meeting, in May 2006. “It’s like Cinderella at the ball. You know that at midnight everything’s going to turn back to pumpkins and mice. But you look around and say, one more dance, and so does everyone else. Everyone thinks they’ll get out at midnight. The party does get more fun, dance partners get prettier, - one more glass of champagne. And besides, there are no clocks on the wall. And then suddenly, the clock strikes 12, - and everything turns back to pumpkins and mice,” the sage of Omaha said.
Nowadays, there’s a multitude of speculators who are engaging in the US-dollar carry trade, all betting that they’ll reach the exit door first, before the clock strikes midnight, - or when the Fed begins to tighten liquidity. However, recent signs that the US-economy is rebounding from its two-year slump, at a much faster pace than expected, has widened the US-Treasury’s yield curve to its steepest level in more than two-decades, a sure sign, that Fed rates won’t stay pegged near zero percent much longer, and that higher interest rates lie ahead in 2010.
Although the Yield Curve is signaling that the clock will strike midnight, as early as Q’2, 2010, Fed officials continue to implore US$ carry traders to dance on the dollar’s grave awhile longer. “The recession now appears to be over, but the economy is still weak and the unemployment rate is much too high,” said NY Fed chief William Dudley on Dec 7th. “These circumstances underpin the Fed’s commitment to keeping short-term rates exceptionally low for an extended period.”
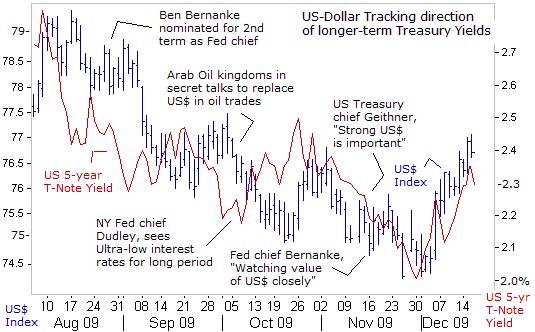 Dudley says the US-economy still faces “quite a few headwinds generated by the hangover of the financial crisis. Banks are still under pressure from credit losses, and the shadow banking system is impaired. Next year, growth will be slightly weaker, as fiscal stimulus fades,” he explained. Dudley emphasizes that the Fed has the ability to exit smoothly from its extraordinary stimulus, when the time arrives, but that day of reckoning is still several months away.
Still, over-extended US$ carry traders began scaling back their bets on Dec 4th, after US Labor apparatchiks shocked the market, by reporting that 11,000 jobs were lost in November, far less than what was expected, and the best showing for the jobs market since the “Great Recession” began. Labor apparatchiks skewed the numbers further, figuring that 159,000 fewer jobs were lost in September and October than previously reported. Four sectors, including the government, added jobs.
Since the Labor apparatchiks unleashed their bombshell report, yields on the US Treasury’s 5-year note have risen by 30-basis points, to around 2.30% today, which in turn, had the effect of lifting the US-dollar index higher. Beijing has often voiced its dismay over the Fed’s policy of printing money to buy Treasury debt, and Japan’s ministry of finance is greatly disturbed by the dollar’s slide under 90-yen, which threatens to choke-off its export led recovery. Thus, behind the scenes, America’s two largest creditors might be demanding a credible defense of the US-dollar, by the Treasury, which can only be engineered with higher interest rates.
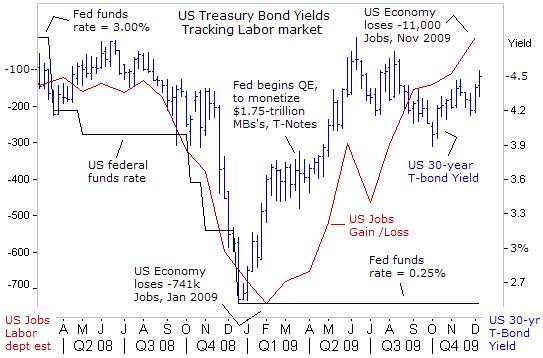 As experts debate the potential speed of the US recovery, one figure looms large but is often overlooked: nearly 1 in 5 Americans is either out of a job, too discouraged to look for a job, or working part-time, at a lesser wage. According to Labor’s broadest measure of unemployment, the U-6 jobless rate is 17.2%, the highest since the Great Depression of the 1930’s. Still, bond traders are looking through the front view window, not backwards, and see job creation returning next year.
Bond-market Vigilantes are monitoring developments on the labor front, and have jacked-up 30-year Treasury yields to 4.55% today, on expectations of a tighter Fed policy starting next year. On October 12th, St Louis Fed chief James Bullard said a falling unemployment rate is a precondition for an up-tick in the federal funds rate from near zero. “You want some jobs growth and unemployment coming down. That is a prerequisite for an increase in interest rates. It doesn’t mean you need unemployment all the way down to more normal levels,” Bullard added. Since 1954, the Fed has raised rates only after unemployment has peaked.
After the last two recessions the Greenspan-Bernanke Fed waited for 2-½-years before tightening. That has fueled criticism that the Fed is quick to slash rates when the stock market is plunging, but slow to raise rates, when the stock market is going up. The outcome of this asymmetrical monetary policy is the emergence of asset bubbles, “boom and bust” cycles, and wild roller coaster rides in the markets.
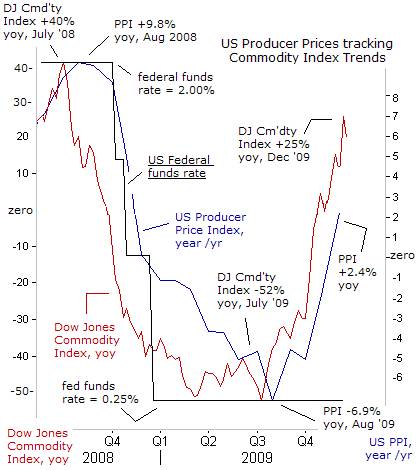 Time is running out on the Fed’s ultra-easy money scheme, after US producer prices rose more than expected in November, lifted by a surge in energy costs, and recording the first year-on-year gain since last November. Labor apparatchiks said prices paid at the farm and factories were +1.8% higher than a year ago, following a +0.3% rise in October. For now, the Bernanke Fed has averted the threat of a deflationary spiral, thanks to its electronic printing press.
The sharp up-turn in the Producer Price Index (PPI) isn’t a surprise to commodity watchers, who track key indicators, such as the Dow Jones Commodity Index, which stands +25% higher than a year ago. The Reuters-CRB Commodity Index is up +39% from a year ago, benefitting from the US dollar’s index’s slide of -9.1% over the same period. If the Fed and US-Treasury allow the dollar to fall further, American households would get slammed by a double whammy, - a lack of job availability and higher commodity prices, for food and energy.
Philly Fed chief Charles Plosser acknowledges that food and energy price shocks can fuel inflation in a way that could become a self-fulfilling prophecy. However, “central banks should not respond to wild swings in food and energy prices with monetary policy unless expectations of inflation become unhinged,” he said on Nov 19th. Chicago Fed chief Charles Evans agrees, saying on Nov 13th, “As long as we can’t detect bubbles with great confidence, it seems unwise to adopt fighting them as a policy objective,” he said, ruling out higher rates to prick bubbles.
Instead, the Fed is calling upon Congress and the CFTC to rein in energy and commodity prices, especially crude oil, by limiting how many futures contracts hedge funds, investment banks and other speculators can control in 2010. However, Terry Duffy, chief of the CME Group says the CFTC’s attempts to curb participation in a regulated marketplace could backfire. “What they are going to do is to drive business out to an unregulated OTC platform, whether it’s in the US through an exchange traded fund (ETF) or a European or Asian entity,” he warned.
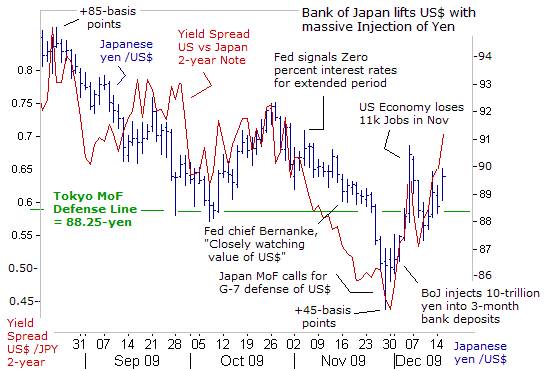 In remarks to the Economic Club of New York on Nov 16th, Fed chief Ben “Bubbles” Bernanke, commented on the US-dollar and its impact on inflation. “Early warnings of actual inflation must be monitored carefully. Commodities prices have risen lately, reflecting the pickup in global economic activity, especially in resource-intensive emerging market economies, and the recent depreciation of the dollar. We are attentive to the implications of changes in the value of the dollar, and will continue to formulate policy to guard against risks to our dual mandate to foster both maximum employment and price stability,” he said.
Yet few traders took Mr Bernanke’s comments seriously, and a week later, the dollar was plunging to a 14-year low of 85-yen in Tokyo. The Bank of Japan began a solo effort to defend the US-dollar, by pumping 10-trillion yen ($115-billion) into short-term bank deposits on Dec 1st, - flooding the system with yen, and in turn, forcing US$ carry traders to cover over-extended short positions. “If there is a shortage of liquidity we are prepared to provide more funds,” Shirakawa warned, driving Japan’s five-year yield to 0.45-percent, a four-year low.
However, the BoJ’s intervention to defend the US-dollar, failed to get the same “bang for the buck” as the 35-basis point up-tick in US Treasury 5-year yields. Small tweaking of interest rates can have noticeable results in the foreign exchange market, where $4-trillion of fiat paper changes hands each day. Following the Labor department’s double barreled dose of US$ friendly news, the yield on the US Treasury’s 2-year note jumped 25-basis points to ´points above Japanese 2-year yields, - elevating the US-dollar towards 90-yen.
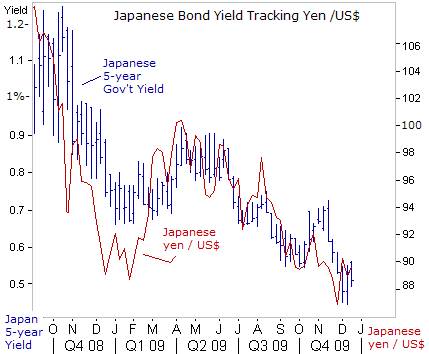 Tokyo’s financial warlords have drawn a line in the sand at 88.25-yen, where they aim to build a floor for the US-dollar. Yet a stronger yen does have a big silver lining, - anchoring Japanese bond (JGB) yields near record lows, and lowering the cost of financing Japan’s outstanding debt. Hirohisa Fujii, Japan’s finance minister said on Dec 8th, new JGB issuance will hit a record 53-trillion yen ($593-billion) in the year ending March, making-up for a plunge in tax revenue. “We would lose the confidence of the JGB market if Japan was to recklessly issue bonds,” Fujii said. “We will make every effort to keep that from happening,” he added.
The IMF says Japan’s public debt could reach 227% of the size of its economy in 2010, greater than the annual output of Germany, France, Britain, and Canada combined. Japan’s government has lived beyond its means since the 1990’s thanks to a massive pool of domestic savings. Households own 1,440-trillion yen ($16.3-trillion) in assets, mostly deposited in banks, which then buy government bonds. Foreigners only hold about 8% of outstanding JGB’s.
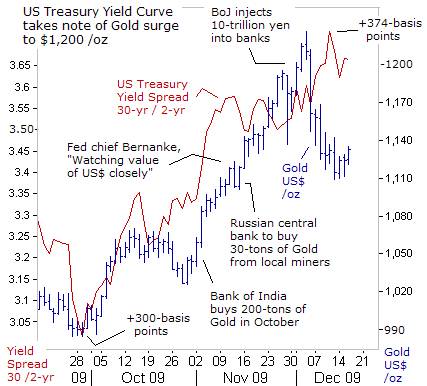
Shortly after the BoJ injected 10-trillion yen into the Tokyo money market, the price of Gold in New York rose above the $1,200 /oz level for the first time ever. Likewise, the US Treasury’s yield curve, measuring the spread between rates on 30-year and 2-year notes, rose to +374-basis points, up sharply from around +304-bp, in late September, when gold was trading near $990 /oz.
The shape of the yield curve reflects the notion that the Fed has taken short-term rates as low as possible and the next shift will inevitably be upwards. Coinciding with sharply higher gold prices, the steep curve suggests there’s a tinge of fear about higher inflation in the future. The slope of the curve doesn’t necessarily reflect the weight of $12-trillion of outstanding supply. Treasury bond prices would probably surge higher, and yields would plummet amid a flight for safety, if the US stock market was to suddenly begin to meltdown again.
When asked about recent market gyrations on Dec 15th, Bernanke argued in the letter that the recent rise in gold prices was not a sign of increasing inflation expectations. “Increases in prices of gold and other commodity over the past few months appear to reflect the recovery of the global economy, and it is not clear they have been out of line with fundamentals,” he said. However, such convenient, and self-serving commentaries by “Bubbles” Bernanke, is a prime example of the Fed’s spin operations and propaganda that is readily soaked-up by the media, and in turn, is utilized to brainwash the general public.
 Global financial markets have a lot of moving parts, and it’s very difficult for anyone to fully encapsulate all the factors that are weighed into any single forecast. That’s why it’s very important to keep an open mind about all possible outcomes, while continuing to gather the facts, conduct analysis, and form an opinion, and conceding one could be wrong. While the general consensus believes the Fed won’t lift rates until late in 2010, it’s the contrarian view which might prevail next year, with the Fed hiking short-term interest rates sooner rather than later.
Former Fed chief Paul Volcker, said on Oct 15th, it was difficult, “but necessary, for the Fed to start draining the billions of dollars in liquidity even while unemployment remains high as the US battles out of recession. You have to act against what seems like common sense. If you wait, it’s too late,” he warned. Two-months later, the Bernanke Fed is still signaling ultra-low rates for an extended period of time.
But would a campaign of baby-step Fed rate hikes knock the gold market off its upward trajectory? Gold tumbled by nearly 10% from its all-time high of $1,125 /oz in recent weeks, on ideas that Fed rate hikes might come sooner rather than later, as suggested by the yield curve. For chartists, the latest slump in gold is a classic removal of speculative froth, which normally follows a parabolic rise.
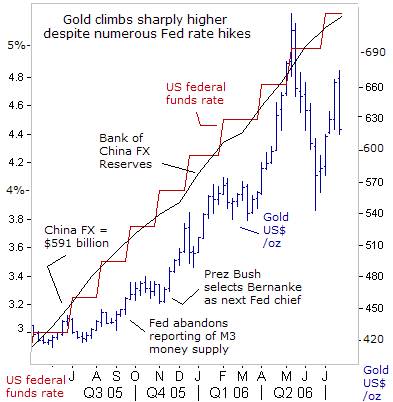
If history is a guide to the future, the gold market has been able to climb sharply higher, alongside a rising fed funds rate. The Fed’s last rate hiking cycle, - starting in June 2004, - and beginning with the fed funds rate at 1%, wasn’t able to cap gold’s powerful advance thru May 2006, until the fed funds rate was lifted to 5.25-percent. Thus, for two-years, gold rose 40%, alongside a 425-basis point increase in the fed funds rate, since the Fed was lingering far behind the inflation curve.
This article is just the Tip of the Iceberg of what’s available in the Global Money Trends newsletter. Subscribe to the Global Money Trends newsletter, for insightful analysis and predictions of (1) top stock markets around the world, (2) Commodities such as crude oil, copper, gold, silver, and grains, (3) Foreign currencies (4) Libor interest rates and global bond markets (5) Central banker "Jawboning" and Intervention techniques that move markets.
By Gary Dorsch,
Editor, Global Money Trends newsletter
http://www.sirchartsalot.com
GMT filters important news and information into (1) bullet-point, easy to understand analysis, (2) featuring "Inter-Market Technical Analysis" that visually displays the dynamic inter-relationships between foreign currencies, commodities, interest rates and the stock markets from a dozen key countries around the world. Also included are (3) charts of key economic statistics of foreign countries that move markets.
Subscribers can also listen to bi-weekly Audio Broadcasts, with the latest news on global markets, and view our updated model portfolio 2008. To order a subscription to Global Money Trends, click on the hyperlink below, http://www.sirchartsalot.com/newsletters.php or call toll free to order, Sunday thru Thursday, 8 am to 9 pm EST, and on Friday 8 am to 5 pm, at 866-553-1007. Outside the call 561-367-1007.
Mr Dorsch worked on the trading floor of the Chicago Mercantile Exchange for nine years as the chief Financial Futures Analyst for three clearing firms, Oppenheimer Rouse Futures Inc, GH Miller and Company, and a commodity fund at the LNS Financial Group.
As a transactional broker for Charles Schwab's Global Investment Services department, Mr Dorsch handled thousands of customer trades in 45 stock exchanges around the world, including Australia, Canada, Japan, Hong Kong, the Euro zone, London, Toronto, South Africa, Mexico, and New Zealand, and Canadian oil trusts, ADR's and Exchange Traded Funds.
He wrote a weekly newsletter from 2000 thru September 2005 called, "Foreign Currency Trends" for Charles Schwab's Global Investment department, featuring inter-market technical analysis, to understand the dynamic inter-relationships between the foreign exchange, global bond and stock markets, and key industrial commodities.
Copyright © 2005-2009 SirChartsAlot, Inc. All rights reserved.
Disclaimer: SirChartsAlot.com's analysis and insights are based upon data gathered by it from various sources believed to be reliable, complete and accurate. However, no guarantee is made by SirChartsAlot.com as to the reliability, completeness and accuracy of the data so analyzed. SirChartsAlot.com is in the business of gathering information, analyzing it and disseminating the analysis for informational and educational purposes only. SirChartsAlot.com attempts to analyze trends, not make recommendations. All statements and expressions are the opinion of SirChartsAlot.com and are not meant to be investment advice or solicitation or recommendation to establish market positions. Our opinions are subject to change without notice. SirChartsAlot.com strongly advises readers to conduct thorough research relevant to decisions and verify facts from various indepe
© 2005-2022 http://www.MarketOracle.co.uk - The Market Oracle is a FREE Daily Financial Markets Analysis & Forecasting online publication.


