Stock Market Update
Stock-Markets / Dow Theory Dec 19, 2009 - 11:41 AM GMTBy: Tim_Wood
 The Dow theory bullish trend confirmation that occurred earlier this year remains intact. Cyclically, the higher degree low that began at the March low also still remains intact. Longer-term, I maintain, based on my data, that this is nonetheless a bear market rally. Once this rally has run its course the big surprise will be the Phase II decline and history shows us that Phase II declines are the most destructive. One reason for this is because with everyone believing that the bear market has ended, the Phase II decline takes everyone by surprise and as the realization begins to set in so does the panic.
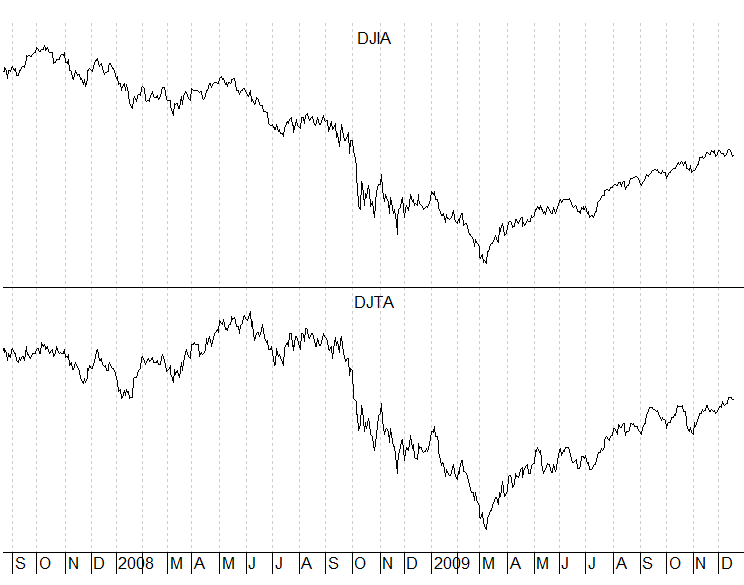
In the first chart below I have included the Dow Jones Industrials and the Transports. From a Dow theory perspective there are no non-confirmations and all appears fine. It is the longer-term aspects of Dow theory, which are not shown on this chart, that are problematic. Those problematic issues being the traditional bull and bear market relationships and values, both of which I have written about in recent postings here.
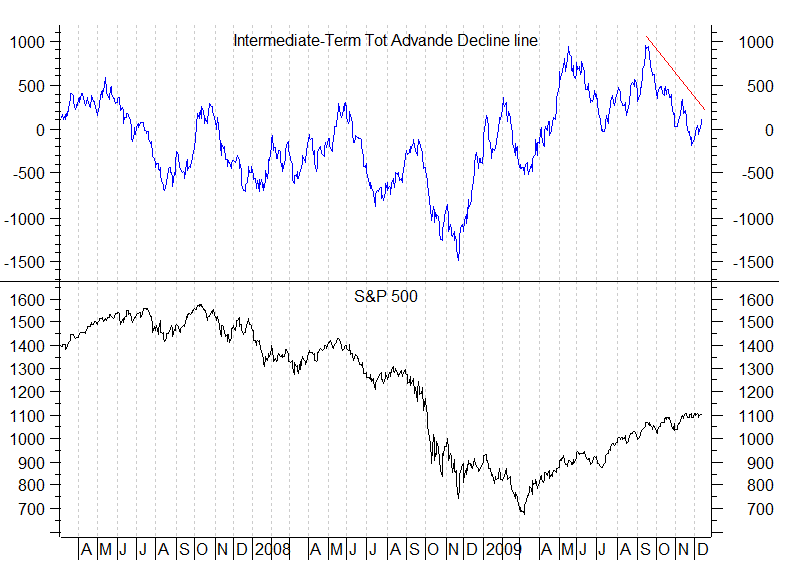
Next I have included a daily chart of the S&P 500 along with my Intermediate-Term Total Market Advance Decline line. The issue here is that the internals are beginning to break down in that the price action over the last 3 months has not been confirmed by this indicator. As a result, a divergence or non-confirmation has formed. These non-confirmations are not sell signals in and of themselves. Rather, they are warnings that something is not right. It is my intermediate-term Cycle Turn Indicator that I watch in order to trigger intermediate-term buy and sell signals.
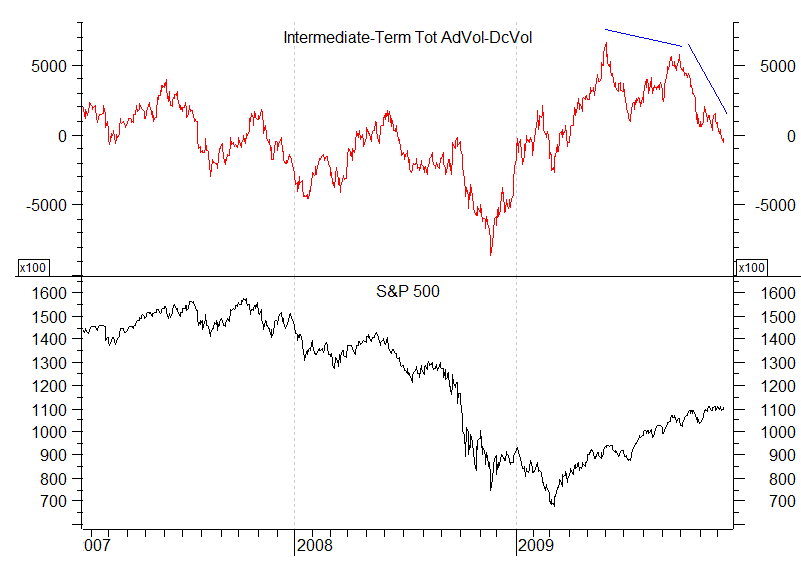
In the next chart below I have included a daily chart of the S&P 500 along with my Intermediate-Term Total Market Volume Indicator. Again, the issue here is that the internals are breaking down in that the price action is not being confirmed by this volume indicator. In this case we have two divergences or non-confirmations that have together grown into an even longer-term non-confirmation. Note that the September high failed to exceed the previous high. Then, from that point, this indicator has continued to weaken even further and has recently moved to an 8 month low. As a result, an even longer-term divergence or non-confirmation has formed. Again, these non-confirmations are not sell signals in and of themselves. They are warnings that price is no longer being confirmed by the internals. It is because divergences are only warnings that I rely on my Intermediate-term Cycle Turn Indicator to trigger intermediate-term buy and sell signals.
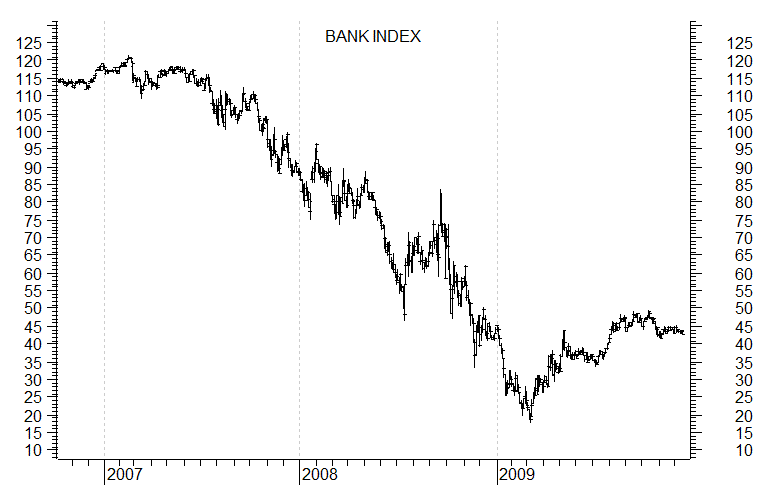
Next I have included a chart of the Banking Index. Note that this index lead at the 2007 top and that it is now showing less relative strength than the broader market. Again, this is not in and of itself a sell signal, but yet another warning.
Next, I’ve also included a chart of the Philadelphia Housing Index and here too, we are beginning to see a softening.
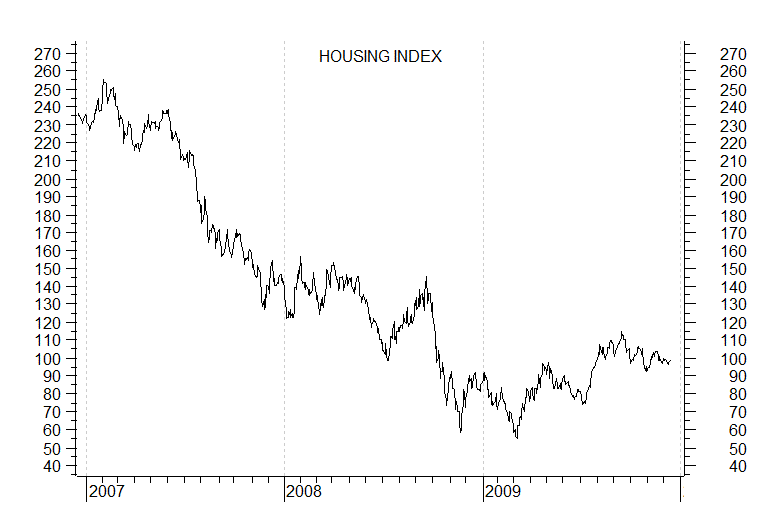
My point here is that all is not well when we look beyond the surface. There are signs for those with the eyes to see them. The internals are no longer confirming the market. Banking and housing are but a couple of examples of relative weakness, which also serve as warnings. Yet, the mainstream media and politicians have the masses lulled to sleep. In my opinion this is a great disservice as it only helps to set the stage for the slaughter that will ultimately follow once the Phase II decline begins. In the meantime, the longer this bear market rally lasts, the more damaging it will ultimately be once it is over. You have been Warned!
I have begun doing free Friday market commentary that is available at
www.cyclesman.info/Articles.htm so please begin joining me there. The specifics on Dow theory, my statistics, model expectations, and timing are available through a subscription to Cycles News & Views and the short-term updates. I have gone back to the inception of the Dow Jones Industrial Average in 1896 and identified the common traits associated with all major market tops. Thus, I know with a high degree of probability what this bear market rally top will look like and how to identify it. These details are covered in the monthly research letters as it unfolds. I also provide important turn point analysis using the unique Cycle Turn Indicator on the stock market, the dollar, bonds, gold, silver, oil, gasoline, the XAU and more. A subscription includes access to the monthly issues of Cycles News & Views covering the Dow theory, and very detailed statistical based analysis plus updates 3 times a week.
By Tim Wood
Cyclesman.com
© 2009 Cycles News & Views; All Rights Reserved
Tim Wood specialises in Dow Theory and Cycles Analysis - Should you be interested in analysis that provides intermediate-term turn points utilizing the Cycle Turn Indicator as well as coverage on the Dow theory, other price quantification methods and all the statistical data surrounding the 4-year cycle, then please visit www.cyclesman.com for more details. A subscription includes access to the monthly issues of Cycles News & Views covering the stock market, the dollar, bonds and gold. I also cover other areas of interest at important turn points such as gasoline, oil, silver, the XAU and recently I have even covered corn. I also provide updates 3 times a week plus additional weekend updates on the Cycle Turn Indicator on most all areas of concern. I also give specific expectations for turn points of the short, intermediate and longer-term cycles based on historical quantification.
Tim Wood Archive |
© 2005-2022 http://www.MarketOracle.co.uk - The Market Oracle is a FREE Daily Financial Markets Analysis & Forecasting online publication.


