


Gold, Hot Commodities and the Major Indexes Trend Trading
Commodities / Commodities Trading Dec 21, 2009 - 01:47 AM GMTBy: Chris_Vermeulen

 Gold has been leading the market for almost a year. Last week gold and gold stocks were trading at support looking ready to bottom but as you will see in my charts below, both broke support on heavy volume.
With gold now under performing the stocks market, I get the feeling we could see the broad market top. Topping is a process and after this strong climb I figure it will be choppy (tough to trade). Much like the price action on the Dow and S&P500 the past month, but this time it will be on a larger scale.
From a technical stand point the major indexes are trading at a key resistance zone from Oct 2008. This has been an amazing year for trading but I think the time has come for a correction or another melt down depending on how you view the US economy. It does not really matter which happens as we can play both directions.
As far as the fundamentals go, well the US economy in my opinion is scary. All I know is that if the markets start to melt down everyone better make BIG money on the way down because a severe correction will cripple the county as millions more will become unemployed. I am concerned that current recession may turn into a depression.
‘If’ we get another stock market meltdown, literally every asset class will go down with it. The only difference I think will be the trend of gold. Everyone has started to buy gold or at least thought about buying some.
‘If’ a meltdown occurs I think gold will go down in price at first with everything else, but if we are headed for another market collapse EVERYONE will turn to gold as the safe haven, triggering a massive parabolic spike straight up which could last years.
Enough of this negative talk, Lets take a look at the short term gold trends.
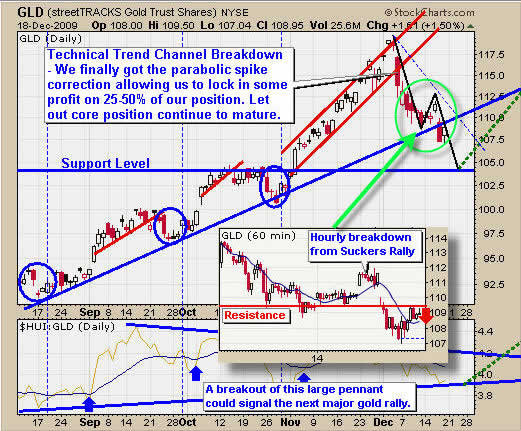
Gold Trend – Daily & 60 Minute Chart
The trend of gold broke down from the red rising channel a couple weeks back as expected. We were taking profits at the $115 level.
The more recent price action shows two technical breakdowns on the daily chart and the small 60 minute overlaid chart. The daily breakdown crashed through our support trend line and the 60 minute chart shows the breakdown below the previous low. The price is currently trading at resistance and the odds now favor lower prices.
Gold Trends
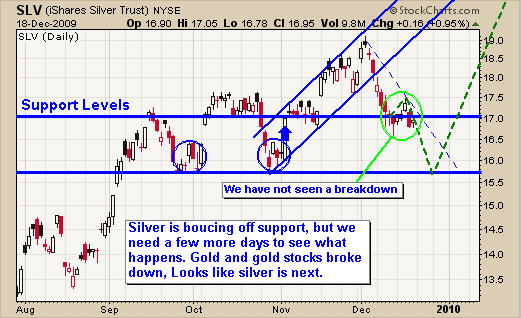
Silver Trend – Daily Chart
Silver is trading at support and has yet to break the previous low. I think we will see this happen in the next few days.
Trade Trends
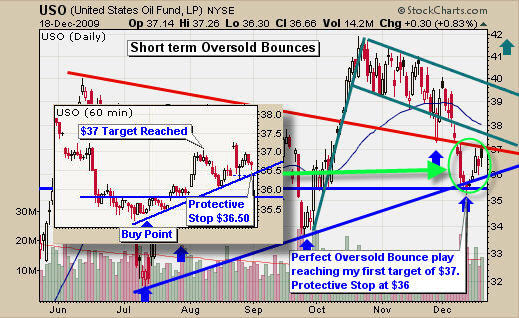
Crude Oil Trend – Daily Chart
Oil had a great setup last week with many readers profiting from the oversold bounce off support which I pointed out on the daily chart last week. When buying into an oversold setup like this I scale in over 2-3 days in case prices dip lower as the selling dissipates. Average price was $35.75 and sold at first target of $37 for a 3.5% profit. Many of us still hold a core position with a tight stop.
The 60 minute chart shows this play and how the price popped once the sellers were cleared out.
Trading Trends
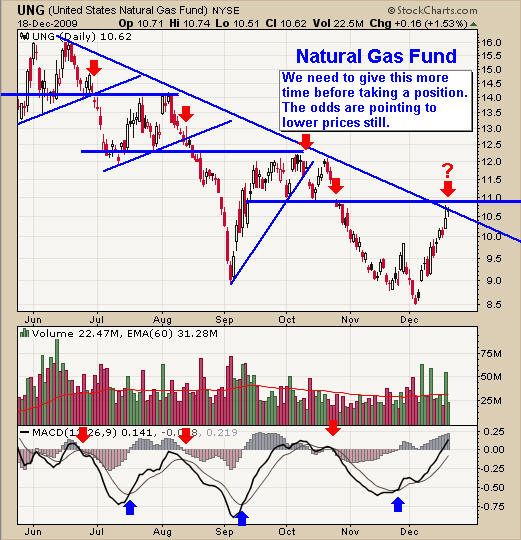
Natural Gas Trading Trend – Daily Chart
Trend lines provide excellent levels for support and resistance and this chart is a perfect example of that. Not much to say about this chart other than UNG is trading at resistance and volume is big. This tells me we could see lower prices from here or some sideways price action first.
Natural Gas Trends
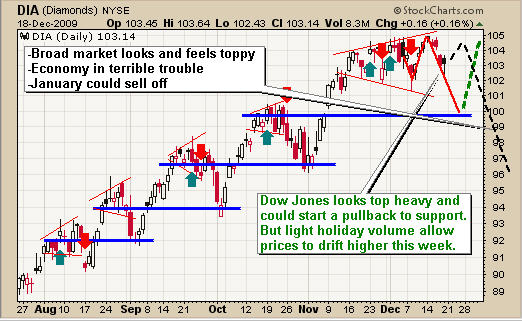
Broad Market Index – Dow Jones ETF – Daily Chart
In short, the market is starting to correct as we thought. It still has more to go before testing support. But because this week is a holiday week, volume will be light and like volume favors higher prices. So we could see the highs tested or sideways action.
From looking at the monthly, weekly and daily charts of the major indices I think the market is about to have a sharp correction. If we get a breakdown then we are headed to the next support level which is about 9% down from the recent high in the DIA etf fund.
Major Index trends
Gold Trend and Technical Conclusion:
The trend of gold has been very predictable over the recent months and this correction seems to be text book pullback. I see the short term trend of gold still down but the longer and more powerful underlying trend is up. Let’s wait for the price of gold and silver to sort itself out and wait for low risk entry points before jumping back in.
Crude oil is in pinball mode. It’s just bouncing around between support and resistance levels now. Not much we can do but wait for another setup.
Natural gas is trading at resistance and if we get the proper price action in the next few days we could have a great short trade. Only time will tell.
The broad market trend is looking and feeling very toppy. A lot of money has been moving out of stocks the past 4 weeks and January could be a roller coaster. Last week I exited all my positions except XTR.TO (Energy and Financial dividend fund) which many of us took a position in late February and first week of March. I have set a tight stop and hoping to get the 4th dividend payout before it corrects.
I want to note that I am not going to be shorting the market until the bear trend is definitive. This could be 2-3 months down the road still. But after a great year of trading and the market and economy looking the way it does I am happy to be sitting in cash.
If you would like to receive my Free Weekly Trading Reports like this please visit my website: www.TheGoldAndOilGuy.com
To Your Financial Success,
By Chris Vermeulen
Chris@TheGoldAndOilGuy.com
Please visit my website for more information. http://www.TheGoldAndOilGuy.com
Chris Vermeulen is Founder of the popular trading site TheGoldAndOilGuy.com. There he shares his highly successful, low-risk trading method. For 6 years Chris has been a leader in teaching others to skillfully trade in gold, oil, and silver in both bull and bear markets. Subscribers to his service depend on Chris' uniquely consistent investment opportunities that carry exceptionally low risk and high return.
This article is intended solely for information purposes. The opinions are those of the author only. Please conduct further research and consult your financial advisor before making any investment/trading decision. No responsibility can be accepted for losses that may result as a consequence of trading on the basis of this analysis.
Chris Vermeulen Archive |
© 2005-2022 http://www.MarketOracle.co.uk - The Market Oracle is a FREE Daily Financial Markets Analysis & Forecasting online publication.