


Stock Market Outlook for 2010, Growth and Risk Appetite Returns
Stock-Markets / Stock Markets 2010 Jan 06, 2010 - 06:40 PM GMTBy: Donald_W_Dony

 The stock markets in 2009 roared upward over 30%. This advance far outstripped fundamental valuations and expectations from many analysts and investors. The fuel for this rise can be largely attributed to the massive government stimulus program. But with the "march of money" anticipated to be removed in 2010, have the equity indexes recovered enough to climb higher without continued tax payer funding or is this run nothing more than a bear market bounce?
Analyzing the strengths or weaknesses of the markets should be accomplished through both a fundamental and technical perspective. Both disciplines provide a unique insight into the dynamics of the markets.
Fair market valuation for the broad-based S&P 500 is between 857 to 1014. The mid-point is about 954. With the current level at 1136, the index is about 19% overvalued. Though this range may cause some market watchers to be concerned and move toward cash, this level of "enthusiasm" is typical during the fledgling stage of a bull market. Investors often drive the markets beyond the fundamental boundaries of fair valuations, especially after steep declines. Bungy-style recoils are more common then most investors realize. As a general rule, the fundamentals finally catch-up to the technicals during the second year of a bull market.
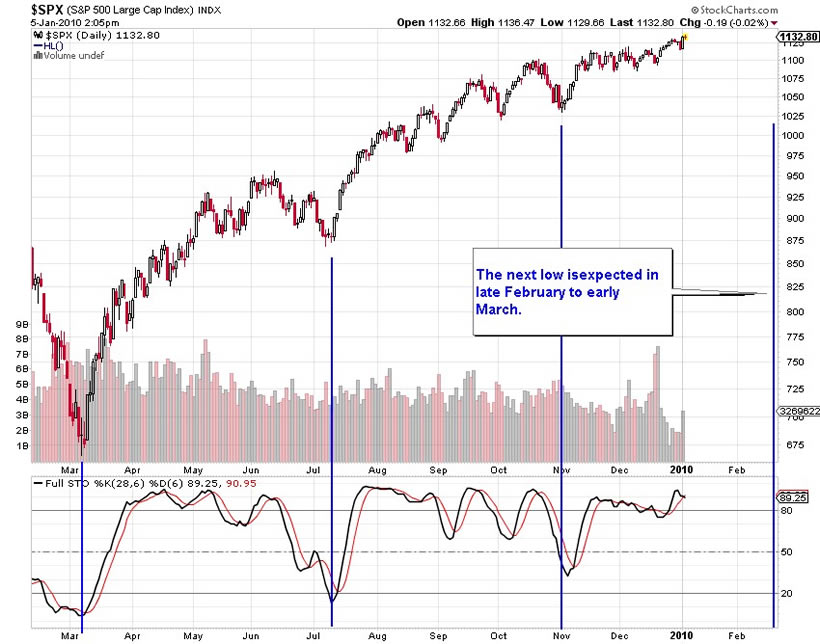
From a technical perspective, short-term models indicate that the S&P 500 should continue advancing in January (Chart1). The price resistance band at 1230 to 1250 is expected to begin slowing the climb. Models forecast another short-term low developing in March. The short-term outlook over the next two months remains positive.
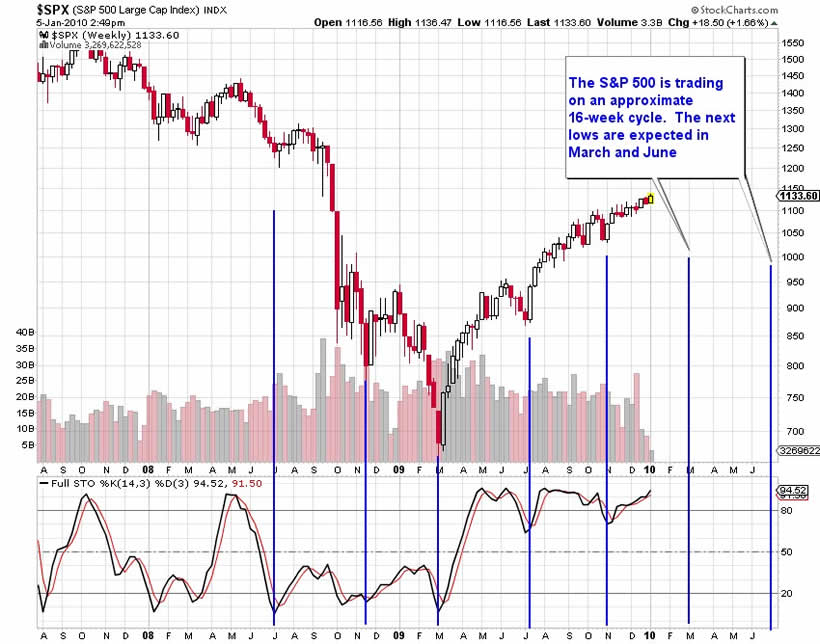
Longer-term models (Chart 2) suggest a similar pattern. As the S&P 500 nears the resistance line at 1230, there is an increasing probability of consolidation occurring. Models highlight that the index is trading on an approximate 16-week cycle. Minor pullbacks developed in March, July and November 2009. This would suggest that the next two key troughs should form in March and June. These troughs are not expected to be deeper than 10%. No technical evidence at this point predicts a greater correction. The longer-term picture suggests a slower climb into mid-2010.
New bull markets typically carry many signs of investors' growing appetite toward risk. Funds start to shift out of safe haven asset classes and sectors and migrate to growth. Normal movement patterns occur with transfers from bonds to stocks, consumer non-cyclicals to cyclicals and defensive staples to higher growth potential mid-and small cap companies. These "classic" shifts develop either in the final stage of a bear market or in the first year of a bull.
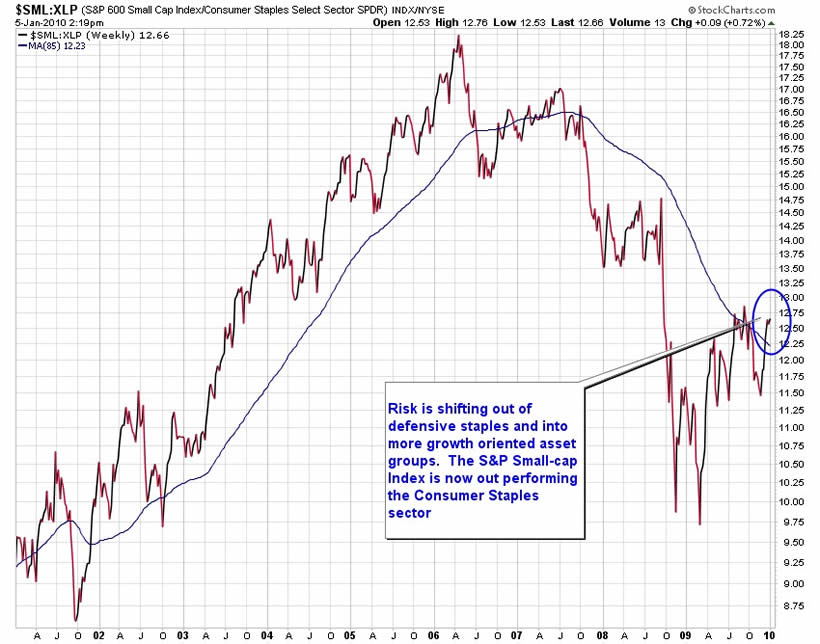
Chart 3 is a graph of the relative performance between two of those important groups. The chart illustrates how the performance in the growth oriented small cap sector began to advance over the safety of consumer staples in 2002. This transfer continued until 2006 when money started flowing out of higher risk S&P 600 Small Cap Index and back into the defensive staples industry group. That pattern remained in place until 2009. Investors once again began transferring capital into the higher risk small cap companies and out of the safety of staples. Chart 3 illustrates that the trend toward growth and risk by late 2009 had clearly changed away from the safe haven consumer staples.
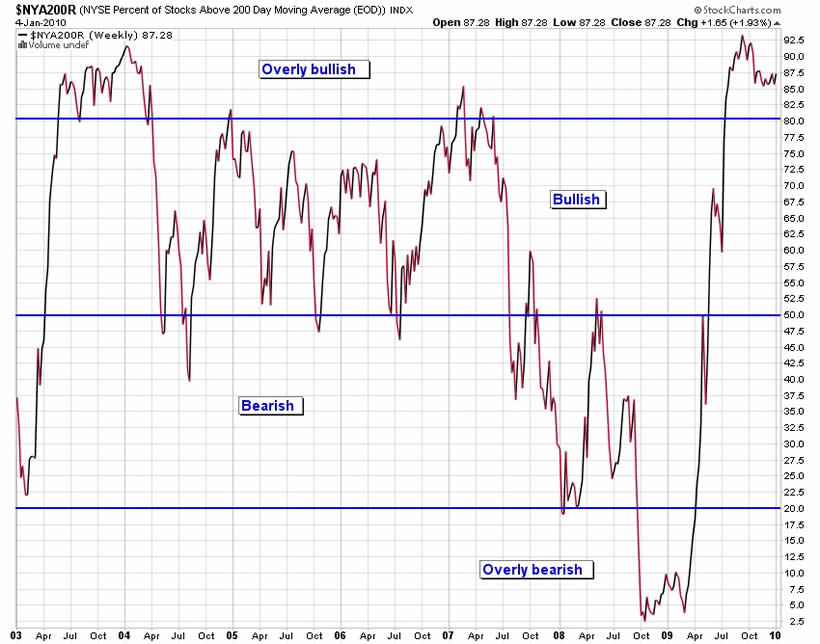
An another important element required in all sustainable bull markets is participation. The vast majority of stocks within a broad-based index has to be trending up if a multi-month or multi-year rise is going to unfold. Chart 4 illustrates that high level of bullish participation. Presently over 87% of the nearly 2,000 equities on the NYSE Composite are trading above their long-term 200-day moving average. A similar pattern developed in the first year of the last bull market (2003). This overly bullish reading highlights the investors' emphases toward growth and risk.
Bottom line: Fundamental valuations are only part of the overall picture when assessing the markets. Though the causes of every bear and bull market differ, the affects are surprisingly similar. Valuation overruns, strong first year performances, transfers within key growth oriented assets classes and sectors coupled with broad market participation are "classic" signs of a sustainable bull market.
Investment approach: Most investors do not participate in the early stages of a bull market, especially after a severe bear decline. This report is designed to provide evidence that the outlook for 2010 is expected to be positive.
The investment vehicle that is best suited to capture the long-term upward movement of the markets are index based exchange traded funds. They provide excellent diversification, transparency, performance and low cost. Suggested index ETFs are:
S&P 500: SPY
DJIA: DIA
NASDAQ: QQQ
S&P/TSE 60 Composite: XIU
Claymore CDN Fundamental Index: CRQ
Your comments are always welcomed.
By Donald W. Dony, FCSI, MFTA
www.technicalspeculator.com
COPYRIGHT © 2009 Donald W. Dony
Donald W. Dony, FCSI, MFTA has been in the investment profession for over 20 years, first as a stock broker in the mid 1980's and then as the principal of D. W. Dony and Associates Inc., a financial consulting firm to present. He is the editor and publisher of the Technical Speculator, a monthly international investment newsletter, which specializes in major world equity markets, currencies, bonds and interest rates as well as the precious metals markets.
Donald is also an instructor for the Canadian Securities Institute (CSI). He is often called upon to design technical analysis training programs and to provide teaching to industry professionals on technical analysis at many of Canada's leading brokerage firms. He is a respected specialist in the area of intermarket and cycle analysis and a frequent speaker at investment conferences.
Mr. Dony is a member of the Canadian Society of Technical Analysts (CSTA) and the International Federation of Technical Analysts (IFTA).
Donald W. Dony Archive |
© 2005-2022 http://www.MarketOracle.co.uk - The Market Oracle is a FREE Daily Financial Markets Analysis & Forecasting online publication.