Inflationary Commodity Super Cycle Bull Market Ready to Rumble in 2010
Commodities / Investing 2010 Jan 07, 2010 - 12:21 AM GMTBy: Gary_Dorsch
 The colossal V-shaped recovery of the global stock markets in 2009 was indeed, the most remarkable feat, ever engineered by the “Plunge Protection Team,” (PPT). Step by step, the Federal Reserve, the US Treasury, and its key allies in the “Group-of-20” nations,rescued the world’s top financiers from their own greedy mistakes. The staggering size of the G-20’s rescue package, totaling about $12-trillion, was equal to a fifth of the entire world’s annual economic output.
The G-20 bailout included capital injections pumped into banks in order to rescue them from collapse, the cost of soaking up so-called toxic assets, guarantees over debt, and liquidity support from central banks.Tossing aside all arguments of “moral hazard,” the PPT utilized all the weapons in its arsenal, to prevent another “Great Depression,” including accounting gimmickry, and the “nuclear option” of central banking – “Quantitative Easing,” (QE), to rescue the global economy.
 History will show that the US stock markets reached bottom on March 10th, when Fed chief Ben “Bubbles” Bernanke and influential members of Congress, exerted heavy pressure on FASB to water-down rule #157, thus, allowing American bankers to once again, value their toxic mortgages, at their own discretionary judgment. The switch-back to “mark-to-make-believe” accounting was the most expedient tool allowing the banking elite to essentially cook their books, - concealing losses, and using discredited models to inflate their balance sheets.
Soon after, a spate of better-than-expected earnings reports by US-banking giants, Goldman Sachs, JP-Morgan, Citigroup, Bank of America, and Wells Fargo began to elevate the stock market higher. On March 15th, 2009, Fed chief Bernanke told CBS’s 60-Minutes, “The green shoots of economic revival are already evident. Much depends on fixing the banking system. We’re working on it. I think we’ll get it stabilized, and see the recession coming to an end this year,” he said. Asked if the United States had escaped a repeat of the 1930’s Great Depression, Bernanke replied, “I think we’ve averted that risk.”
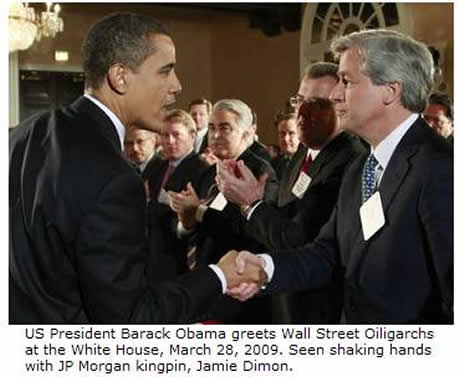
In order to fuel a V-shaped recovery for the stock market, the Fed unleashed the most powerful weapon in its arsenal, – “nuclear QE,” – by pumping $1.75-trillion into the coffers of Wall Street Oligarchs, such as Goldman Sachs and JP-Morgan, through the monetization of Treasury notes and mortgage bonds. In a very short period of time, a tidal wave of liquidity began to flow into high-grade corporate and junk bonds, and whetting the speculative appetite for equities.
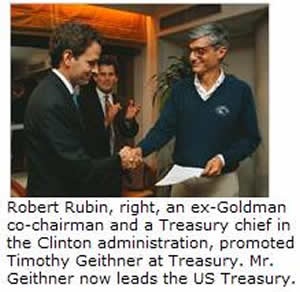 Wall Street Oligarchs utilized trillions in US-taxpayer bailout money and guarantees, to bolster their balance sheets and generate profits, by speculating in turbulent financial markets. Since March 6th, what’s evolved is a rising US-stock market and inflated bank profits, which in turn, conjures-up hopes that banks will start lending again, to free-up capital for business investment. Angling for the so-called “wealth effect,” the PPT is hopeful that household spending will also rebound.
Many investors were skeptical of the “Green-Shoots” rally, and preferred to call it a “bear-market” suckers’ rally, - destined to fizzle-out and unravel. Yet last year’s bargain hunters saw an “once-in-a-lifetime” buying opportunity, and were guided by the sagely advice of Sir John Templeton, “Bull-markets are born in pessimism, grow on skepticism, mature on optimism, and die of euphoria.” Most of all, “Bubbles” Bernanke restored the market’s love affair with the Fed’s printing press.
Beijing holds keys to World Economy, Commodities,
The V-shaped recoveries in the global commodity and stock markets could not have succeeded however, without the aid of China, which accounted for half of the world’s growth in output last year, and is expected to surpass Japan, as the world’s second largest economy in 2010. Beijing went on a buying spree for industrial commodities, especially for crude oil, and base metals, stockpiling the raw materials used for its 4-trillion yuan ($586-billion) spending plan on infrastructure projects.
The People’s Bank of China (PBoC) ordered its banks to power a V-shaped recovery, through an explosion of credit - a record 10-trillion yuan ($1.5-trillion) in new loans, - or double the 2008 total. Roughly a quarter of the new loans were channeled into the Shanghai red-chips and property markets, designed to inflate their values.
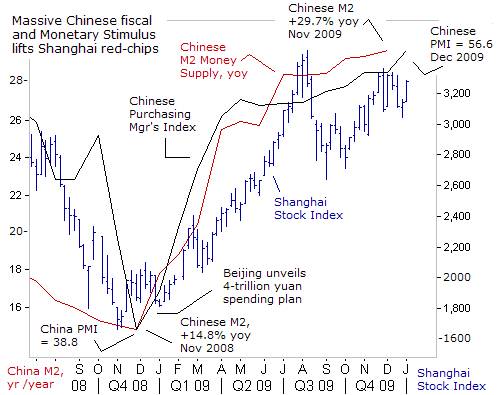 The combined fiscal and monetary stimulus, - equal to 45% of China’s GDP, spurred the juggernaut economy to an estimated +10% growth rate in the fourth-quarter, up from +6% growth in the first-quarter. China’s economic growth is set to return into the double-digits in 2010, with booming factory activity driving its Purchasing Managers’ Index (PMI) to a reading of 56.6 in December from 55.2 in the previous month. South Korea, Asia’s fourth-largest economy, said its exports to China were 75% higher at $54.2-billion, over the first 20-days in December.
However, China’s accelerating economy is also increasing worries among some PBoC think tank economists that the consumer price deflation experienced through most of 2009, will quickly flip to rapidly escalating inflation in 2010. China’s voracious appetite for agricultural commodities, crude oil, base metals, and other industrial raw materials, is transmitting inflationary pressures worldwide, with the epicenter located in China itself and in neighboring India.
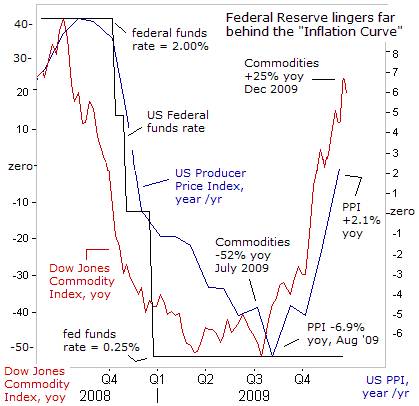
The PBoC finds itself far behind the “inflation curve,” and hasn’t yet gone beyond meaningless “open mouth” operations, in order to tame budding pressures lurking beneath the surface. The Dow Jones Commodity Index made a stunning U-turn last year, rebounding sharply from an annualized rate of decline of -52% in July, to an annual inflation rate of +23% in December. With key commodity prices expected to extend their advance in the year ahead, an outburst of escalating inflation lies on the horizon for the Chinese economy.
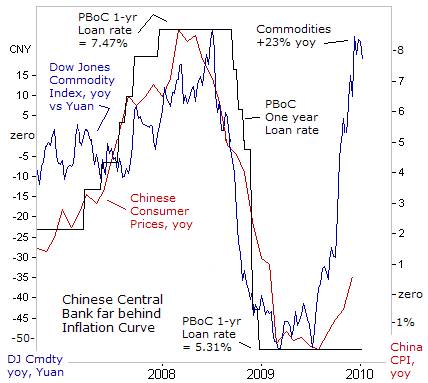 Fan Gang, an influential member of the PBoC, has warned the markets that the central bank would gear its monetary policy toward dealing with the asset bubbles it created. China’s banking regulator aims to slow new lending to around 7.5-trillion yuan, or 25% less than last year. On Dec 30th, Yu Xuejun, a top banking regulator warned, “actual money supply growth for 2010 will be controlled below 20% in 2010, and the 17% growth target for M2 decided at the Central Economic Work Conference will be implemented seriously,” he said.
On Jan 5th, China’s central bank chief Zhou Xiaochuan added, “We will keep a good handle on the pace of monetary and credit growth, guiding financial institutions towards balanced release of credit and avoiding excessive turbulence,” he said. Zhou said forcing banks to put aside more of their deposits on reserve with the PBoC is a key tool for mopping-up cash flowing into the economy.
So far, traders in Shanghai are skeptical of the warnings. Instead, the PBoC’s threat of slower money growth is viewed as a bluff. Last year, Beijing set a growth target of +17% for M2, but instead, expanded it 30-percent. If the 17% target for M2 growth is taken seriously, the PBoC would have to aggressively soak-up yuan thru T-bill sales, or force banks to lend less, in order to contain inflation. Yet if the PBoC doesn’t tighten its monetary policy, consumer price inflation could easily accelerate at a +6% clip in 2010, blowing even bigger asset bubbles caused by excessive liquidity.
PPT Engineers V-shaped Recovery, Inflation
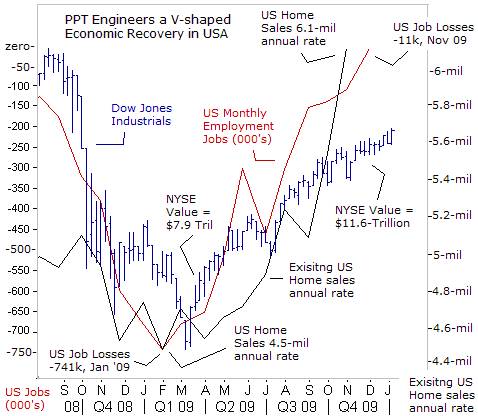 “We came very, very close to a depression. The markets were in anaphylactic shock,” Bernanke told TIME magazine last month. “I’m not happy with where we are, but it’s a lot better than where we could be,” he said. Bernanke and the “Plunge Protection Team,” confounded their skeptics last year, - proving that a central bank can engineer a V-shaped economic recovery, from the depths of the Great Recession, by pumping vast quantities of money in the capital markets.
Since the March 2008 lows, US-listed stocks recouped $5.2-trillion in value, boosting household wealth, and confidence in the fate of America’s $14-trillion economy. Even with foreclosure filings in the US reaching a record 3.9-million last year, sales of existing homes in November rose to a 6.54-million annual rate, the highest level in three-years, although foreclosures accounted for 33% of all sales. The S&P/Case-Shiller index of average home prices was 29% lower in October 2009 from its peak in July 2006, making homes more affordable.
The Dow Jones Industrials ended last year at 10,425, recouping most of its losses from the apocalyptic meltdown since September 2008, when Lehman Brothers went into bankruptcy, and in a domino effect, toppled other Wall Street titans. Nowadays, financial markets are under the constant surveillance of G-20 central bankers and treasury officials, always attempting to influence their direction.
One of the tools of the PPT is “Jawboning,” or brainwashing operations, designed to influence trader psychology and behavior in the markets. Governments have another key tool at their disposal, - the ability to fudge key economic statistics, to achieve the political aims of the ruling parties. Such was the case on Dec 4th, when Labor apparatchiks shocked the markets, saying the US-economy had lost a scant 11,000 jobs, the fewest since the Great Recession started in December 2007.
 For extra “shock and awe,” the BLS dropped another bombshell, saying the number of jobs lost in September and October were 159,000 less than originally reported. Moreover, employers are increasing work hours and hiring temporary employees to meet rising demand, - the first steps before hiring permanent workers. The number of temporary workers jumped 52,400, the largest increase in five-years. These trends are solidifying ideas the US-economy could actually see job creation in the second quarter, and give the Fed enough wiggle room to begin draining liquidity.
Similar to the PBoC’s dilemma, the most worrisome side-effect of the Fed’s ultra-easy money scheme is a revival of inflation, which if left unchecked for too-long, could morph into hyper-inflation. When measured in US$ terms, the Dow Jones Commodity Index is now +25% higher than a year ago, a reliable indicator pointing to higher costs of goods from the nation’s farms and factories.
Ordinarily, a resurgence of inflation would be a worrisome development for stock market operators, out of fear the Fed might tighten the money spigots. However, the Bernanke Fed says it’s content to linger far behind the “inflation curve,” for an extended period of time, preferring higher commodity prices over a deflationary depression. Thus, talk of the Fed’s exit from its ultra-loose QE scheme and draining the liquidity swamp, as telegraphed by the extreme steepening of the Treasury yield curve, is still a bit premature. In any case, government apparatchiks can always skew the inflation statistics, to buy the Fed more time to keep rates low.
Chinese Dragon Gobbles-up Base metals,
Fed officials argue that with so much excess capacity in the industrial sector, tight credit, and a weak job market, that fears over an outbreak of inflation are overblown and imaginary. However, the notion that excess industrial capacity, - with supply outstripping demand, - will contain prices was repudiated in the base metals markets last year. Copper soared 140%, Lead, used in car batteries, doubled to $2,416 /ton, followed by zinc, up 125%, and aluminum, was up 50-percent.
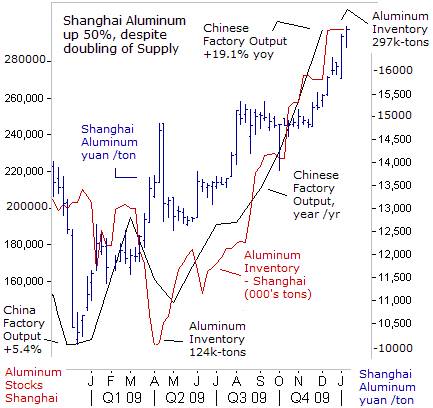 Base metals rocketed sharply higher despite a large build-up of inventories stocked in warehouses in London and Shanghai. Aluminum inventories held at the London Metals Exchange are bulging at near record levels of 4.6-million tons. Global output of aluminum is running at 38.4-million tons /year exceeding demand at 35-million tons. Yet aluminum futures in Shanghai rose to 17,000-yuan /ton, up 60% from a year ago, with Chinese factory output running 19% higher.
Japanese buyers paid premiums of $130 /ton over the spot price for longer-term contracts, after a European trading house bought over 1-million tons from Russia’s Rusal, the world’s biggest aluminum producer. Investment bankers are utilizing new and creative ways of lending money to base metal producers, with nearly 70% of the supply of aluminum sitting in LME warehouses tied-up in such financing deals, and therefore, not available for delivery in the spot market.
Bankers are buying aluminum on the spot market and selling forward at a profit. The metal is stored with a warehouse until delivery. Bankers are financing the deals by borrowing US-dollars in the Libor market at 0.25%, thus creating artificial demand for aluminum. However, there’s always the risk that such quasi “carry trades,” could be unwound in a violent way, when the Fed begins to lift Libor rates.
Still, base metals are buoyed by Chinese demand, absorbing 43% of the world’s supply last year. China imported 1.45-million tons of aluminum in the first eleven months of 2009, up 1,225% from the previous year, and 3-million tons of copper, up 136-percent. The cash price for iron ore doubled from their March lows, to $118 /ton, as Chinese steel mills imported 566-million tons, up 38% compared with the same period of last year. Demand for base metals is likely to get a further boost as factories based in the G-7 nations rebuild their inventories.
Crude Oil Tests OPEC’s Upper Limits,
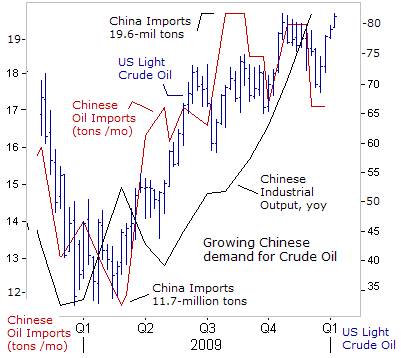
The Chinese dragon is also blazing a trail under the crude oil market. After sliding to a five-year low under $33 /barrel in December 2008, oil prices staged a steady climb upward to $82 this week, aided by Chinese stockpiling. On Jan 5th, Zhang Xiaoqiang, deputy of China’s National Development commission, said he’s “actively” involved in the global competition for crude oil, natural gas, and minerals to satisfy the country’s thirst for raw materials. Beijing has $2.25-trillion in foreign currency reserves at its disposal, to invest in “infrastructure facilities in key countries which hold resource deposits and have a friendly relationship with China,” Zhang said.
 A key component of Beijing’s strategy is to guarantee access to Persian Gulf oil especially from Iran and Saudi Arabia. China is the #1 importer of crude oil and natural gas from Iran, and the two allies are bound by energy deals reaching a total value of $120-billion and growing. China and Japan have been involved in a bidding war over a major pipeline deal to deliver Russian oil from Eastern Siberia.
In Africa, Beijing has invested $8-billion in joint exploration contracts in the Sudan, including the building of a 900-mile pipeline to the Red Sea, which supplies 7% of China’s oil imports. Beijing has also concluded oil and gas deals with Argentina, Brazil, Peru, and Ecuador. But its main interests are focused in Venezuela, and ambitious oil deals in Canada, the #4 and #1 oil suppliers to the United States.
Boosting autos sales has been a key ingredient of Beijing’s stimulus program. China has overtaken America as the world’s #1 buyer of automobiles, not surprising since its population of 1.3-billion persons is more than quadruple that of the US. Roughly 12.7-million cars and trucks were sold in China last year, up 44% from the previous year and far surpassing the 10.3-million sold in the US.
To meet its growing industrial and transportation needs, China’s imported 17.1-million tons of crude oil in November, up 28% from a year earlier, emerging as the world’s #3 importer after the US and Japan. But China’s demand for oil could double in the next 10-years, according to the IEA, if its economy continues to expand at a 10% growth rate. At some point, the growth in Asian and world demand for oil would exceed the available supply, leading to triple digits for oil prices.
On Dec 25th, Saudi Arabia’s King Abdullah told a Kuwaiti newspaper, “Oil prices are heading towards stability. We expected at the beginning of the year an oil price between $75 and $80 per barrel and this is a fair price,” he said. The Saudi kingdom has about 2.5-million barrels per day of excess oil capacity, and could dump more oil on the market, to prevent prices from climbing above $80 /barrel.
However, speculators in the oil markets are putting Riyadh to the test, betting that the kingdom would allow a rally to $85, with a background of a steadily improving V-shaped recovery in global stock markets. Abdullah hinted at this, when he said, “Oil prices might rise reasonably,” keeping pace with other asset markets.
 China and PPT knock froth off Gold market,
China has also vaulted ahead of India to become the world’s buyer of Gold, as small investors scrambled to defend their wealth against the explosive growth of the Chinese money supply. Demand for the yellow metal was expected to eclipse the 450-ton mark, while gold imports by India fell in half to around 200-tons. India used to import around 600-to-800-tons of gold every year, but even now, the United Arab Emirates may have overtaken India in gold imports. Still, Indians have accumulated 20,000-tons worth over $730-billion of Gold in private hands.
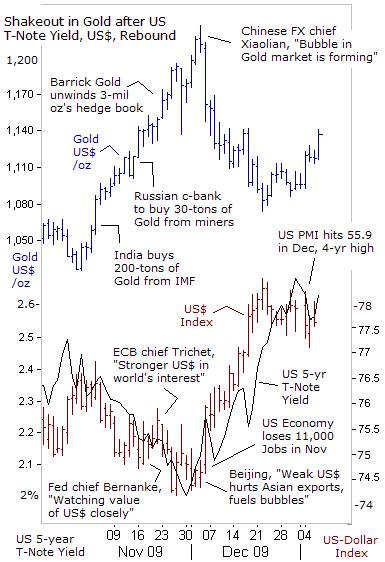
Gold rose for a ninth straight year in 2009, gaining 24%, even after shaving $130 /oz off its all-time high of $1,225 /oz, set on Dec 2nd. Interestingly enough, gold peaked just a few hours after China’s FX chief, Hu Xiaolian, warned traders in Shanghai to be careful of a potential asset bubble forming. “Watch out for bubbles forming on certain assets, and be careful in those areas,” he said.
On Dec 4th, the People’s Daily, the main newspaper of the ruling Communist Party, blasted the Fed’s weak US$ policy, saying it was forcing Asian nations to choose between a “heavy blow to exports” and inflation risks, from “massive liquidity in their own currencies, further inflating asset prices,” it said. Tokyo was also calling on the G-7 central banks to help bolster the US-dollar, as it plunged to a 14-year low of 85-yen, and triggering a death spiral in the Nikkei-225 Index to the 9,000-level.
With America’s two largest creditors complaining bitterly about the weak US$, the PPT was bailed-out by Labor department apparatchiks on Nov 4th, releasing a better-than-expected outlook on the jobs market. The Fed acquiesced to Beijing and Tokyo, by allowing yields on the Treasury’s 5-year note to zoom 70-basis points higher, thus forcing US$ carry traders to cover over-extended short positions. In turn, unwinding of US$ carry trades, knocked the gold market for a nasty shake-out.
Beijing and the “Plunge Protection Team” bought a few extra weeks of precious time for their shell game of currency debasement. However, if talk of an exit from the Fed’s QE scheme, or the PBoc’s threat to slowdown the M2 money supply, adds-up to nothing more than empty rhetoric, - then we’ll witness another parabolic rise in Gold, and the resurgence of the “Commodity Super Cycle” in 2010.
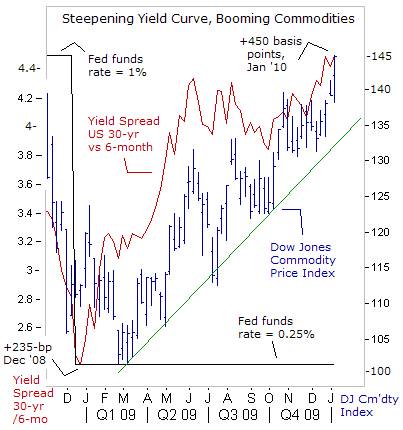 G-20 spin artists are telling the media that inflation won’t get out of control, because excess capacity in the industrial sector can keep factory and farm prices down. However, outside the Ivory Towers of academia, such theories carry little weight in the marketplace. Instead, the message of the US Treasury’s yield curve is signaling a major outbreak of inflation, with the spread between 30-year and 6-month yields steepening to +450-basis points, the widest in three-decades.
Traders are plowing billions of dollars, Euros, and yen into commodities and precious metals, betting on the debasement of all paper currencies. The resurgence of the “Commodity Super Cycle” is kicking into high gear, with G-20 central bankers fueling asset bubbles, by refusing to lift short-term interest rates. “Paper money eventually returns to its intrinsic value – zero,” Voltaire, 1729.
This article is just the Tip of the Iceberg of what’s available in the Global Money Trends newsletter. Subscribe to the Global Money Trends newsletter, for insightful analysis and predictions of (1) top stock markets around the world, (2) Commodities such as crude oil, copper, gold, silver, and grains, (3) Foreign currencies (4) Libor interest rates and global bond markets (5) Central banker "Jawboning" and Intervention techniques that move markets.
By Gary Dorsch,
Editor, Global Money Trends newsletter
http://www.sirchartsalot.com
GMT filters important news and information into (1) bullet-point, easy to understand analysis, (2) featuring "Inter-Market Technical Analysis" that visually displays the dynamic inter-relationships between foreign currencies, commodities, interest rates and the stock markets from a dozen key countries around the world. Also included are (3) charts of key economic statistics of foreign countries that move markets.
Subscribers can also listen to bi-weekly Audio Broadcasts, with the latest news on global markets, and view our updated model portfolio 2008. To order a subscription to Global Money Trends, click on the hyperlink below, http://www.sirchartsalot.com/newsletters.php or call toll free to order, Sunday thru Thursday, 8 am to 9 pm EST, and on Friday 8 am to 5 pm, at 866-553-1007. Outside the call 561-367-1007.
Mr Dorsch worked on the trading floor of the Chicago Mercantile Exchange for nine years as the chief Financial Futures Analyst for three clearing firms, Oppenheimer Rouse Futures Inc, GH Miller and Company, and a commodity fund at the LNS Financial Group.
As a transactional broker for Charles Schwab's Global Investment Services department, Mr Dorsch handled thousands of customer trades in 45 stock exchanges around the world, including Australia, Canada, Japan, Hong Kong, the Euro zone, London, Toronto, South Africa, Mexico, and New Zealand, and Canadian oil trusts, ADR's and Exchange Traded Funds.
He wrote a weekly newsletter from 2000 thru September 2005 called, "Foreign Currency Trends" for Charles Schwab's Global Investment department, featuring inter-market technical analysis, to understand the dynamic inter-relationships between the foreign exchange, global bond and stock markets, and key industrial commodities.
Copyright © 2005-2010 SirChartsAlot, Inc. All rights reserved.
Disclaimer: SirChartsAlot.com's analysis and insights are based upon data gathered by it from various sources believed to be reliable, complete and accurate. However, no guarantee is made by SirChartsAlot.com as to the reliability, completeness and accuracy of the data so analyzed. SirChartsAlot.com is in the business of gathering information, analyzing it and disseminating the analysis for informational and educational purposes only. SirChartsAlot.com attempts to analyze trends, not make recommendations. All statements and expressions are the opinion of SirChartsAlot.com and are not meant to be investment advice or solicitation or recommendation to establish market positions. Our opinions are subject to change without notice. SirChartsAlot.com strongly advises readers to conduct thorough research relevant to decisions and verify facts from various independent sources.
Gary Dorsch Archive |
© 2005-2022 http://www.MarketOracle.co.uk - The Market Oracle is a FREE Daily Financial Markets Analysis & Forecasting online publication.


