One More Nail In The Coffin Of The Gold Bears
Commodities / Gold and Silver 2010 Jan 08, 2010 - 01:54 PM GMTBy: Peter_Degraaf
 “The State is that great fiction by which everyone tries to live at the expense of everyone else.” ….. Frederic Bastiat.
The bullish case for gold continues to build. The old adage ‘more dollars chasing fewer goods’ is particularly apt for gold.
- For the first time in history practically every Central Bank is adding to the money supply of its respective country.
- Despite a record high gold price, new supply from mines is declining, due to the fact that the ‘easy to find gold’ has already been found.
- Comparing the current gold rush to the price rise in 1980 we find that there are currently 2.4 billion people in the world who were not alive in 1980. That is an increase of 53%!
- A large percentage of this huge increase has occurred in China and India. By coincidence the people in those two countries love to own gold.
- Mining costs are increasing, due to the fact that the price for raw materials used in construction is rising. The price of oil has doubled in price during the past 12 months. Earth moving machines and large trucks use up a lot of oil!
- Red tape and bureaucracy slow down the building of a new mine. It can take as much as ten years and require a billion dollars to build a substantial gold mine today.
- Greenlight Hedge Fund recently converted its position of holding shares in GLD into physical gold. A lot of traders and hedge fund managers follow the trading pattern of GHF. Their example is moving from ‘paper into physical’.
- Central Banks have seen the ‘writing on the wall’ and on balance have become buyers of gold instead of sellers. Since they own the printing presses, they have no problem coming up with the funds.
- The Chinese Central Bank holds record amounts of US dollars, while their holding of gold at 1.8% is among the lowest percentage of central bank holdings. They are on record of wanting to ‘buy the dips’.
- Investment demand is increasing as more and more investors become aware of the gold bull market.
- As currencies lose favor with the public, there will be a growing number of government officials who will call for a ‘stable currency’ to replace the fiat currencies, in particular to replace the over-inflated US dollar.
- It is a historical fact that once a country goes down the path of currency inflation, (instead of taxation in order to pay its debt), in every instance that currency eventually becomes worthless. It has happened in at least 40 countries (including the USA) in the past.
- Gold discounts future price inflation, and by rising predicts the price inflation that follows monetary inflation.
- The US Monetary Base (controlled by the US FED), rose from zero in 1776 to 800 billion dollars in 2008. Since 2008 it has risen by 1200 billion dollars, to the current 2 trillion dollars.
- The monetary inflation in the USA alone dwarfs anything that has happened in the past, including WWI, WWII, the Korean conflict, and the race to the moon.
- Politicians have no conception of the amount of dollars that make up a trillion.
Most of them have never even run a candy store! The vast majority have never had to ‘meet a payroll.’
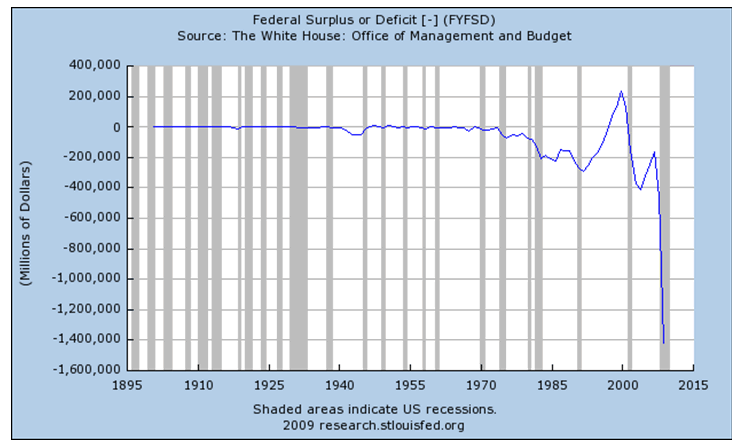
This chart (courtesy Federal Reserve Bank of St. Louis), shows the current federal deficit. This deficit must either be paid for with an increase in taxes (not likely), or by borrowing (from whom?), or by ‘currency degradation’ (very likely).
The gold bears (especially the deflation crowd), continue to steer people away from buying gold. They are costing their readers potential profits!
They warn their readers that the US dollar is about to stage a miraculous recovery. Perhaps this next chart will throw some cold water on that argument.
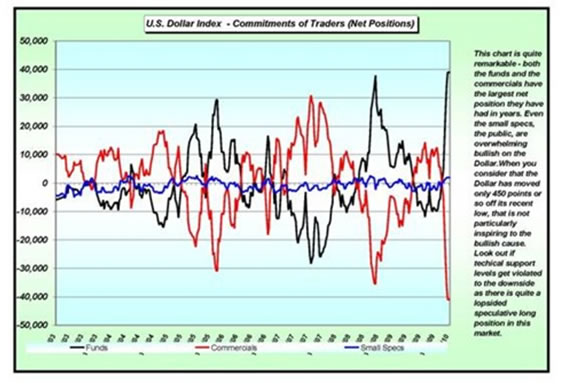
This chart courtesy Dan Norcini who is a ‘super chartist’ at jsmineset.com.
The red line follows the ‘net short’ position of commercial traders in the US dollar. The ‘net short’ position at the moment is more than 40,000 contracts. This is the largest ‘net short’ position for at least seven years. In late 2005 the chart shows us a net short position of 30,000. The US dollar (next chart), at about that time topped out at 92 and fell to 71.
In late 2008 the net short position reached 35,000. The US dollar back then topped out at 88 and fell to 77.5.
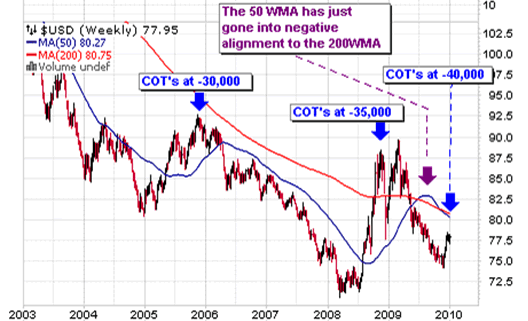
Chart courtesy Stockcharts.com.
In order for the US dollar to stage a rally from here, the dollar bulls are going to have to do battle with the commercial traders who have a vested interest in holding the line, and are capable (as in the past), to cause the dollar to fall. Fundamentally, the FED is not able to support the dollar with higher interest rate. Not now! Maybe later on, but not now!
Another argument put forth by the gold bears is this: ‘The DOW is about to crash and when that happens, gold shares will fall just as hard’.
What say the charts?
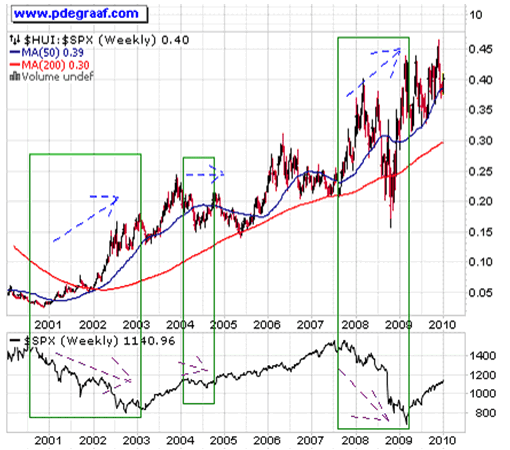
This chart courtesy Stockcharts.com, highlights periods where the HUI index of gold and silver stocks rose faster than the S&P 500 index (top of chart), while the S&P 500 was declining (bottom of chart).
During two of the three periods highlighted here, the HUI outperformed, while the S&P declined, while in 2004 the HUI held its own while the S&P fell.
So much for the argument that gold stocks will fall when the S&P suffers a drop in value!
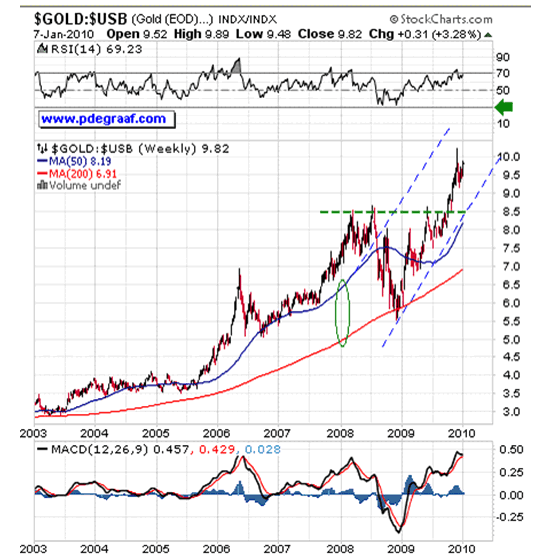
Featured is the index that compares gold to bonds. It compares ‘real wealth’ to ‘certificates of guaranteed confiscation’ (that is what Ludwig von Mises called bonds).
The breakout at the 8.50 neckline in the reversed ‘head and shoulders’ formation predicts a target at the green arrow. This is a bull in full gallop. The higher this trend goes, the more money will flow from disappointed bond holders into the gold market. Notice the positive alignment of the two moving averages (green oval).
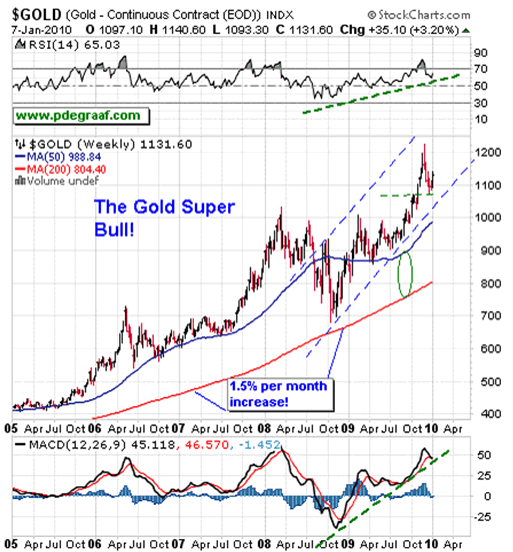
We end this article with the current gold chart. Price has found support at the 1070 level and is ready to rise to new heights, based on the fundamentals listed at the top of this essay. The bears will try to hold gold down below 1145, but they are expected to fail after a while. .
As long as gold stays above the rising 200 week moving average, the increase is 18% per year. That’s better than money in the bank – much better!
Notice the positive alignment between the two moving averages (green oval).
In previous articles (available in the archives), I pointed out the importance of these ‘golden crossovers’, and in so doing was able to keep my subscribers from selling their gold (except for a spot of profit-taking at the end of November 2009).
“Those who buy the dips and ride the waves will prosper” ….Richard Russell.
Happy trading!
By Peter Degraaf
Peter Degraaf is an on-line stock trader with over 50 years of investing experience. He issues a weekend report on the markets for his many subscribers. For a sample issue send him an E-mail at itiswell@cogeco.net , or visit his website at www.pdegraaf.com where you will find many long-term charts, as well as an interesting collection of Worthwhile Quotes that make for fascinating reading.
© 2010 Copyright Peter Degraaf - All Rights Reserved
DISCLAIMER: Please do your own due diligence. I am NOT responsible for your trading decisions.
Peter Degraaf Archive |
© 2005-2022 http://www.MarketOracle.co.uk - The Market Oracle is a FREE Daily Financial Markets Analysis & Forecasting online publication.


