U.S. Stock Market Indexes Cyclical Trend Forecasts 2010
Stock-Markets / Stock Markets 2010 Jan 15, 2010 - 09:41 AM GMTBy: Jim_Curry
 As we forge ahead into the year 2010, it is a good idea to step back and get an overall perspective on the US stock indexes, both from a cyclical point of view - as well as to get a look at the accompanying technical action.
First, a look at the mid-term time cycles on the S&P 500 index:

The 45 Day (8-10 week) Cycle
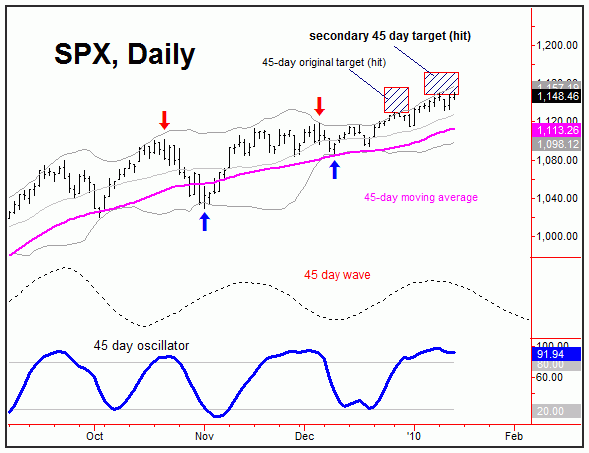
The most dominant mid-term cycle (for tradability purposes) is the 45-day component, shown on the chart above. The 45-day cycle's last bottom is the 12/9/09 low of 1085.89 - which puts this component at 24 days along to the upside, currently regarded as bullish - but is starting to roll over. This cycle is due to top out anytime, next looking to bottom in early-to-mid February.
In taking a look at this 45-day cycle from a statistical point of view, the 12/9/09 bottom ended up seeing the pattern of a 'higher-low'; when this pattern has been seen in the past, then the average rally phase has been in the range of 25 trading days off the bottom. This inferred that the probabilities were better-than-average that this cycle would hold up into mid-January or later.
In terms of price, back in November this 45-day component had confirmed an upside projection to the 1130.09 - 1153.63 region on the SPX - which was satisfied back on 12/29/09. An even higher upside target for the SPX was later indicated to the 1148.16 - 1172.38 area - which the index has also met with the strength seen in recent days. This price zone should also provide firm near-term resistance to the upward phase of this component.
The next good swing top for the daily chart should come with the topping of this 45-day component. Once it peaks, then the probabilities will favor a decent correction with the same into February, one that has above-average odds of retracing back to or below the rising 45-day moving average - wherever it is at the time. Depending on how the downward phase of this component plays out, it will tell us a lot about whether higher highs will be seen again on the next upward phase that follows.

The 90-day (18-20 week) Cycle
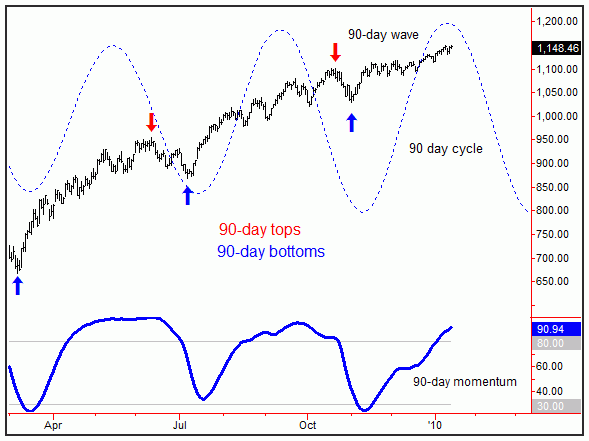
Approximately every other 45 day bottom will mark a low for a larger (but less dominant) 90-day wave (chart, above). This larger cycle is currently seen as 50 trading days along, last bottoming on 11/2/09. It is currently regarded as slightly bullish - but is also in topping range; it is next due to bottom out sometime in the month of March of this year.
In taking a statistical look at this 90-day cycle, when this component has registered the pattern of a 'higher-low' in the past (as it did at the November bottom) then the average time rally has been in the range of 55 days from trough to peak. If this proves correct for the current upward phase, then it would suggest that this cycle's peak could hold off until on or after the third week of January.
In terms of price, the average rally with this 90-day wave (in it's current pattern) has been in the range of 14% or greater before the following peak was in place. This suggests that the SPX has the potential to move as high as the 1173 figure or better before this cycle tops out.
Once this 90-day cycle does peak, then a correction with the same should materialize into a March bottom. In terms of price, the minimum expected decline phase should be about 4% off the top for the SPX - though the statistical average has actually been closer to 6.2%. This is similar to what was seen going into both the July and November (2009) bottoms, both of which were 90-day cycle lows.

The 180-day (9-month) Cycle
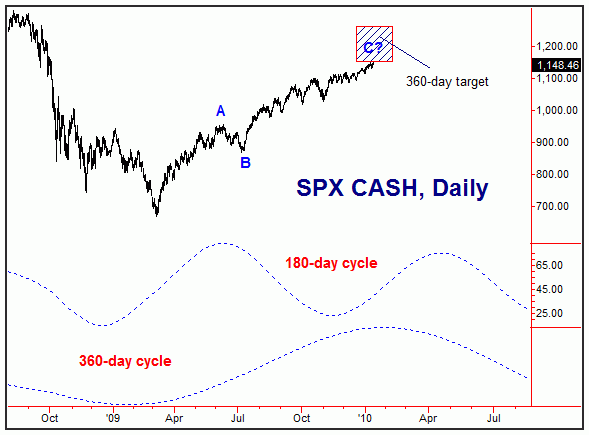
Like the smaller 90-day component, the 180-day cycle (chart, above) is seen as 50 days along and is currently regarded as bullish into late-Spring of 2010. The next bottom for this component is scheduled to occur in the Autumn of this year.
In terms of time, when this 9-month cycle has formed the pattern of a 'higher-low' in the past (as it did at the November, 2009 bottom), then the average rally into it's following top has lasted trading 133 days. If the SPX were to see something similar on this go-around, then this cycle (and thus the SPX) won't see it's next larger peak made prior to the month of May.
In terms of price, the average rally with this cycle (within the above pattern) has been 24% from trough to peak - which would suggest that the SPX has the potential to move as high as the 1276 figure before it's next high is in place. Just below that we have the 1228 level which should provide an upside magnet in the months ahead; this number is the approximate 61% retracement of the move down from the October, 2007 peak (1576) to the March, 2009 bottom (666.79).
The 360-day (18-month) Cycle
The larger 360-day cycle is now viewed as 217 days along and is still regarded as bullish off the 03/06/09 swing low of 666.79. Like the smaller 180-day component, this 360-day wave is looking to peak late-Spring of 2010, and is next due to low out in the Autumn of this year.
In terms of price, back in mid-April of 2009 this 360-day cycle had confirmed an initial upside projection to the 965.93 - 1032.41 area for the SPX, which was met on 7/23/09. On or about the same time (July, 2009), the cycle had confirmed an additional - and more aggressive - target to the 1151.97 - 1263.45 range, which we are very close to satisfying with the current action. In terms of patterns, the current assumption has been that the SPX was in the midst of a larger (Elliott) ABC corrective rally, with the B wave having bottomed at the 869.32 swing low back in July - and the current C wave deemed to be in force into late-Spring of this year; you can see this more clearly on the 180/360-day chart. Interestingly, wave 'C' will be equal to wave 'A' at the 1158 figure on the SPX, which could provide shorter-term resistance to one of the smaller (45/90-day) upward phases. Even said, the statistical observations with price with the 180-day cycle suggests that the C wave ultimately is going to see an extension, a normal enough occurrence.
The 4-Year 'Presidential Cycle'
The year 2010 puts the various indexes in the 'mid-term' year of the Presidential cycle pattern, which has a history of recording larger price bottoms. Normally, the mid-term election pattern will end up seeing strength in the earlier part of the year - and then is followed by a sharp decline into an Autumn low. From there, the market normally turns up into year-end and into the first quarter of the following year (2011).
Overall, the path suggested by the mid-term year of the presidential cycle seems to line up with what the 180 and 360-day time cycles are currently suggesting - which is an Autumn, 2010 bottom. There have been numerous studies regarding the presidential cycle, but the key one to note is that, since the 1930's, the market has normally witnessed an average rally of around 50% from the mid-term bottom to the following year's (pre-election) high. Taking this a bit further, the period from November of mid-term year to April of the following year (2011) has seen an average rally of approximately 18% over that shortened time span.
The bottom line with both the cycle and the seasonal analysis is that the smaller 45 and 90-day cycles are closing in on near-term peaks, and could give way to a decent-percentage correction into the month of March. The current indications are that any shorter term decline would be followed by higher highs into late-Spring (May/June) - with the potential for the SPX to make a move into the mid-to-high 1200's before all is said and done. However, after the 180 and 360-day cycles top in late-Spring, the combination of these waves should then to give way to a sharper decline phase into the Autumn months - which should also mark the bottom for the four-year presidential cycle.

Technical Action
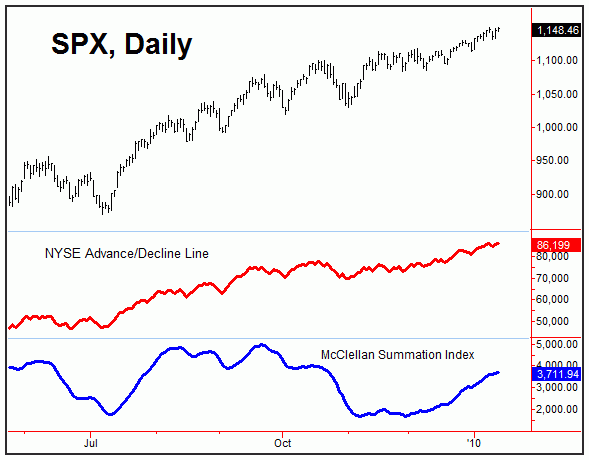
Lastly, to supplement what the cyclical analysis is currently suggesting, we need to take a look at the technical strength of the market. In looking at a chart of the advance/decline line (shown above), we can see that this index is currently making new highs for the move - which tends to confirm the larger upside trend. Normally, any major price peak should see the A/D line diverging from price action - and usually in a big way. The fact that it is not doing at the present time favors that higher highs will continue to be registered with the 180 and 360-day cycles into late-Spring of 2010 - even though various corrections should be seen in-between with the smaller 45 and 90-day components - both of which are beginning to roll over. The action of the A/D line would also tend to add credence to the statistical notes regarding price with the 180-day component, which infers a potential move to the mid-to-high 1200's on the SPX before all is said and done.
However, for the shorter-term action, the McClellan Summation index (bottom pane of the chart above) is showing a mild divergence from price - which will normally occur at smaller 45/90-day degree tops. In other words, the short-term technical action tends to favor that we will soon see a correction with the smaller cycles - but the larger technicals would favor that correction to give way to higher highs again into May or June of this year. At that time, we can reassess the action with the longer-term advance/decline line, to try and discern whether a more important peak is attempting to form.
By Jim Curry
Market Turns Advisory
email: jcurry@cycle-wave.com
website: http://cyclewave.homestead.com
Jim Curry is the editor and publisher of Market Turns advisory, which specializes in using cyclical analysis to time the markets. To be added to our mailing list click HERE
Disclaimer - The financial markets are risky. Investing is risky. Past performance does not guarantee future performance. The foregoing has been prepared solely
for informational purposes and is not a solicitation, or an offer to buy or sell any security. Opinions are based on historical research and data believed reliable,
but there is no guarantee that future results will be profitable. The methods used to form opinions are highly probable and as you follow them for some time you
can gain confidence in them. The market can and will do the unexpected, use the sell stops provided to assist in risk avoidance. Not responsible for errors or
omissions. Copyright 1998-2007, Jim Curry
JIm Curry Archive
|
© 2005-2022 http://www.MarketOracle.co.uk - The Market Oracle is a FREE Daily Financial Markets Analysis & Forecasting online publication.


