


Gold Price Waiting for Trigger for a Futher Decline
Commodities / Gold and Silver 2010 Jan 16, 2010 - 03:27 PM GMTBy: Merv_Burak

 Unexpected events often have a shock effect on the markets. The shock may last for some time or go away quickly. As far as the precious metals market is concerned, the recent earthquake should have only a minor effect.
GOLD : LONG TERM
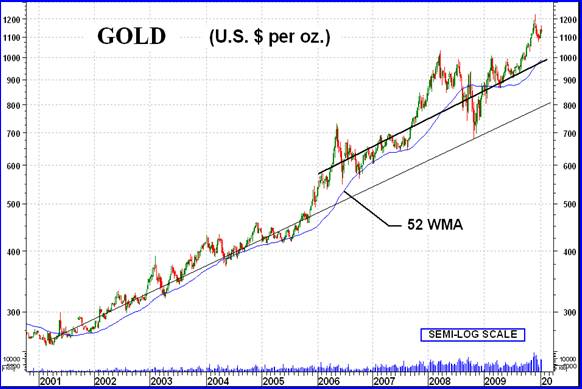
We now have nine years of a basic long term bull market in gold bullion. How long will it last? Who knows? We will continue following it until it collapses and then follow it towards the next bull market. The bull and bear markets will continue for at least as long as I will be on this planet.
This chart is interesting from the standpoint of showing that the gold up trend continues at a constant percentage rate change. On a semi-log scale chart a straight line is a line that shows a constant percentage change over any equal time period. On a geometric scale chart, the usual kind, a straight line shows a constant dollar change over equal time periods. After some 5 years of a steady climb gold seemed to have taken off and entered a new dimension. The price volatility greatly increased but the constant percentage rate change stayed the same, after the thrust up to new levels. This more volatile price action has continued for the past 4 years with the extremes becoming more noticeable.
We are once more at the top of one of these extremes. What from here? Well, as I see it we have two options. First we could react back to the solid black up trend line or even drop below the line to consolidate the recent years of action before heading once more higher. We could also go into a new burst of activity, similar to the activity at the end of 2005 into 2006, leading to a new level of trend, higher than the present one, similar to what happened in early 2006. My guess is that we are likely to see more downside action but that’s only a guess. The market has not signaled such a move yet. At the very least, one should not ignore the possibility of a major decline ahead and be prepared to protect one’s capital from loss. Stick with the trend but don’t close your eyes if the trend should end.
So, where are we as far as the trend is concerned? The price of gold continues to trade above its positive sloping moving average line. The long term momentum indicator continues to trend in its positive zone but has just crossed below its trigger line. The trigger is still, however, pointing upward. The volume indicator continues to track higher and remains above its positive trigger line. So, from the long term perspective all is still okay and the rating remains BULLISH.
INTERMEDIATE TERM
The intermediate term indicators are not quite as positive as are the long term ones but still nothing is collapsing yet. The gold price continues to trade above its positive moving average line but not far above the line. The price could drop below the moving average with a day or two of negative action but for now it remains above the line. The momentum indicator continues above its neutral line in the positive zone but here too it is not that deep in the zone. The indicator has moved below its trigger line and the trigger here has turned slightly to the down side. As for the volume indicator, it remains positive and above its positive sloping trigger line. For now the intermediate term rating remains BULLISH but things could change fast with any volatile downside action.
SHORT TERM
One usually spots changes in price direction here in the short term section but unfortunately, a too much concentration on many of these short term indicators could cause confusion as they may give us contradictory information. I stick to a very few indicators that have done reasonable service over time and not try to get too sophisticated in my analysis. Trend is generally based upon the appropriate moving average line although support and resistance levels are also used where appropriate. Strength of latest price action is gauged by the use of an appropriate time period “momentum” indicator. I prefer the Relative Strength Index (RSI) for this. As for a gauge of market participation, a review of daily volume action is used. So, let’s run through those indicators.
The price is sitting right on top of its short term moving average line with the line still pointing in an upward direction. The momentum indicator is still in its positive zone but heading lower fast. It is already below its negative sloping trigger line and just about to go into the negative zone. As for the daily volume action, it has been improving over the past few days. The speculators are coming back into the market after the holidays. All in all, the short term rating remains BULLISH but is very precarious and could change momentarily.
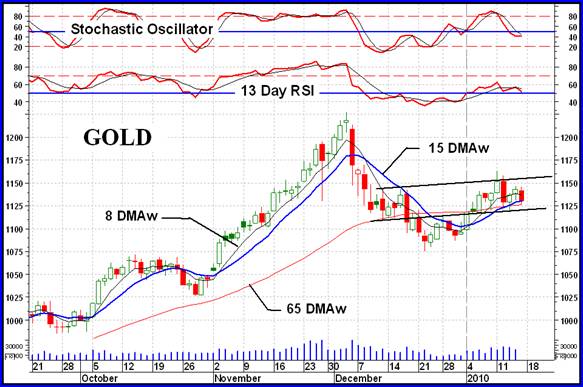
The short term head and shoulder pattern shown last week has to be slightly adjusted. The right shoulder was not completed last week. This week we have a somewhat clearer picture of the right shoulder and it provides us with an upward slanted neckline trend. The left and right shoulders are bunched nicely in an upward trending channel. A break through this head and shoulder pattern will now require a close above the upper resistance channel line (the new neckline).
Trying to guess the immediate direction of least resistance is often a coin toss, especially with a few days inactivity before the next market day when anything can happen. However, there are some indicators that could help in guessing this next direction. The best one is the Stochastic Oscillator. It has been moving lower for days and has entered its negative zone. However, it seems to be in a turning process and just about to cross above its trigger line. The very short term moving average line is more negative having turned to the down side with the price closing below the line. I’ll stick with the lateral direction as the one with least resistance until the price moves out of the channel area.
SILVER
Several things of note on the silver chart. First the price versus the moving averages. The price remains above both the intermediate and short term positive sloping moving average lines for positive trends. The short term average has also crossed above the intermediate term line for a confirmation that the intermediate term is in a bullish phase. Although we have had a decline in price during Dec, even dropping below the intermediate term moving average line for most of the month, the momentum indicator remained in its positive zone throughout, except for one day drop just very slightly below the neutral line. The momentum indicator has, however, been warning of weakness in the price over the past few months as seen in the lower momentum indicator values at the past three price highs. Finally we have the volume indicator. It has been in a positive trend for many months indicating upside volume activity by speculators. The indicator even made a new high on Thursday while the price was still below its previous high.
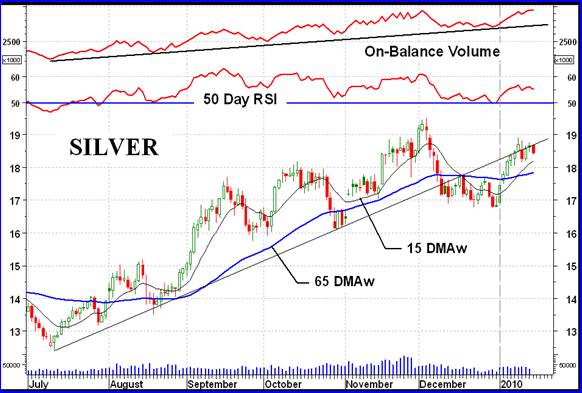
All this suggests that despite some weakness recently the bull market in silver is still some distance from ending. Bull markets do not go steadily upward. They go up and down with more upside action than downside action. We seem to be in one of those downside action periods. Despite what seems to be, the ratings based upon the technical indicators remain BULLISH for all time periods.
PRECIOUS METAL STOCKS
Last week was a very good week for gold and silver stocks. This week was a bummer. Almost all of the major North American Indices declined by 5%, give or take a few fractions. The Merv’s Indices declined less with the Qual-Gold and Qual-Silver being the worst with declines of 3.4% and 3.3%. Once again the Merv’s Penny Arcade was the stand-out Index with a GAIN of 6.2%. It should be noted that last week’s Penny Arcade gain of 13.4% was in error. It should have been 9.4%, still the best performer that week. The error was due to a reverse split in one stock that went unnoticed. Things were corrected during the week. The Penny Arcade is continually reviewed for changes. These penny stocks are not as stable as most stocks are so a constant review is needed. This past week several stocks were replaced in the component list. The replaced stocks may not necessarily have been bummers but the new stocks seem to have a better chance of becoming those 10 or 20 baggers gamblers are always looking for.
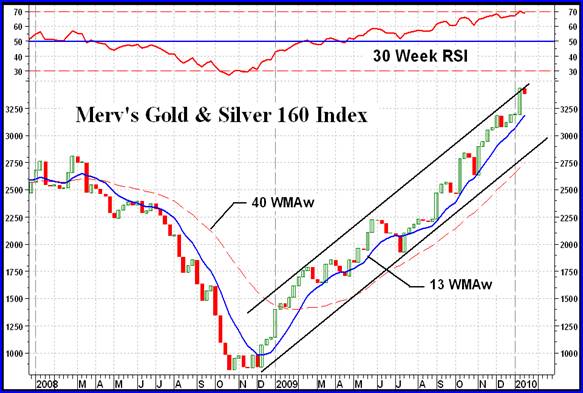
The “universe” of 160 stocks that make up the Merv’s Gold & Silver 160 Index have been performing quite well since turning around in late 2008. The average price of a component stock has gained 300% since bottoming out in late 2008 but there are signs that we might be in for some rough times ahead. Since starting its bull move the Index has been trapped inside an up trending channel. It is presently at the top of the channel. Odds are that the action from here might be to the down side towards the lower trend line or could be lateral gentle easing its way towards the middle of the channel. In any case the odds seem to be for a rough period ahead. The long term momentum indicator is also suggesting downside action ahead. The indicator entered its overbought zone last week and reacted lower this week. The long term overbought area is an area from which many market reactions start. Although these indicators DO NOT say sell everything and get out they are cautioning against any new purchases at this time. The risk fact has increased greatly with these indicators. One would wait and see how the individual stocks are doing and go with their ratings for your appropriate investment or speculative time period (ratings for all stocks are provided to subscribers of the Precious Metals Central gold service, see link below).
It should be noted that although the Merv’s Gold & Silver 160 Index is well into new highs, as is the Merv’s Penny Arcade Index, the major North American Indices are still not at new high levels. This is a strong suggestion that the “quality” stocks, the higher market valued stocks that are over weighted in the North American Indices, are under performing the general mass of gold and silver stocks. There are some good performers in this quality section but in general they are under performing the majority of gold and silver stocks.
Looking at the “king” of the North American Indices, the PHLX Gold/Silver Sector Index, it still has more than 10% to go before it gets into new high territory. It has advanced 144% on a weekly closing basis since it reached its bottom in late 2008 (as opposed to the 160 Index advance of 300%). The PHLX is in a similar up trending channel as the 160 Index but is closer to the lower up trend line. It could be that should we get a reaction over the next few weeks it might hit the more aggressive stocks harder than the quality stocks. We’ll just have to wait and see.
Merv’s Precious Metals Indices Table
Well, that will be it for this week.
By Merv Burak, CMT
Hudson Aero/Systems Inc.
Technical Information Group
for Merv's Precious Metals Central
For DAILY Uranium stock commentary and WEEKLY Uranium market update check out my new Technically Uranium with Merv blog at http://techuranium.blogspot.com .
During the day Merv practices his engineering profession as a Consulting Aerospace Engineer. Once the sun goes down and night descends upon the earth Merv dons his other hat as a Chartered Market Technician ( CMT ) and tries to decipher what's going on in the securities markets. As an underground surveyor in the gold mines of Canada 's Northwest Territories in his youth, Merv has a soft spot for the gold industry and has developed several Gold Indices reflecting different aspects of the industry. As a basically lazy individual Merv's driving focus is to KEEP IT SIMPLE .
To find out more about Merv's various Gold Indices and component stocks, please visit http://preciousmetalscentral.com . There you will find samples of the Indices and their component stocks plus other publications of interest to gold investors.
Before you invest, Always check your market timing with a Qualified Professional Market Technician
Merv Burak Archive |
© 2005-2022 http://www.MarketOracle.co.uk - The Market Oracle is a FREE Daily Financial Markets Analysis & Forecasting online publication.