


They Don't Ring A Bell At The Stock Market Top
Stock-Markets / Stock Markets 2010 Jan 17, 2010 - 04:45 PM GMTBy: Guy_Lerner

 There are two kinds of bulls: 1) there are those bulls who are intent on squeezing every last percentage point from this rally and who believe they can find the exits when the music finally stops; and 2) then there are those bulls who continue to have high expectations that the current market environment will yield strong returns. The latter type of bulls are unlikely to realize strong gains without a significant pullback, and by significant I mean that the pullback should get investors to think that the market is rolling over to such a degree that the current cyclical highs will never be revisited. The former type of bulls are likely overestimating their ability to get to the exits or identify the top before the next trader. Either way, complacency reigns as they don't ring a bell at the top.
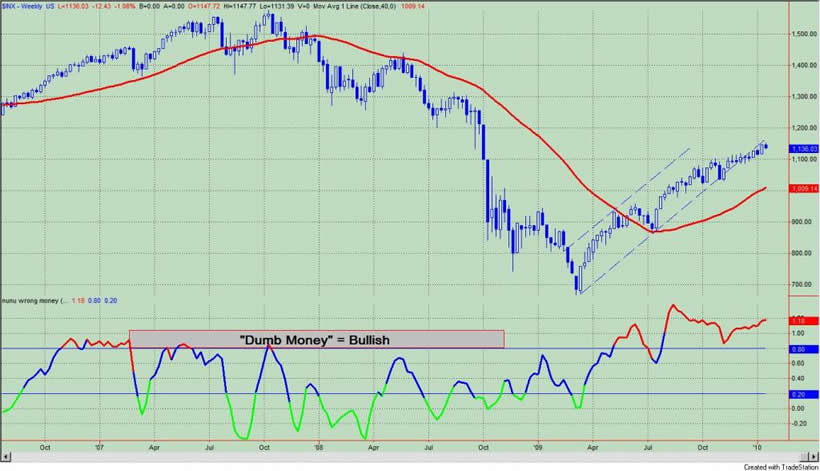
The "Dumb Money" indicator, which is shown in figure 1, looks for extremes in the data from 4 different groups of investors who historically have been wrong on the market: 1) Investor Intelligence; 2) Market Vane; 3) American Association of Individual Investors; and 4) the put call ratio. The "Dumb Money" indicator shows that investors remain extremely bullish.
Figure 1. "Dumb Money" Indicator/ weekly
The "Smart Money" indicator is shown in figure 2. The "smart money" indicator is a composite of the following data: 1) public to specialist short ratio; 2) specialist short to total short ratio; 3) SP100 option traders. The Smart Money indicator is neutral to bearish.
Figure 2. "Smart Money" Indicator/ weekly
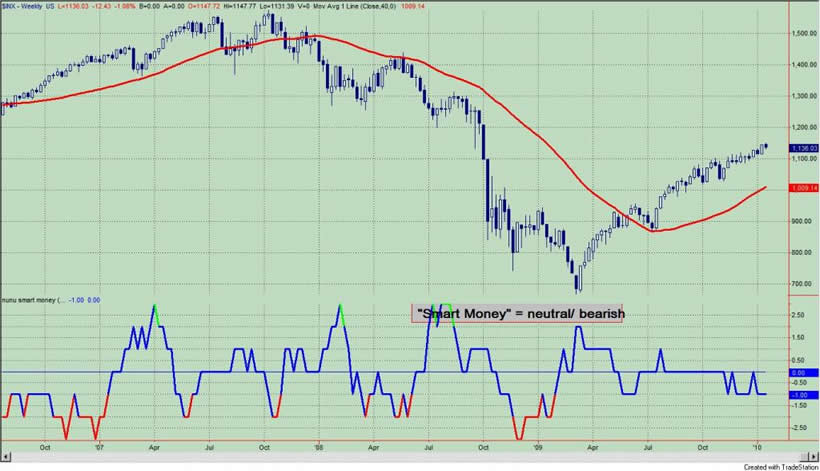
Figure 3 is a weekly chart of the S&P500 with the InsiderScore "entire market" value in the lower panel. Due to the start of earnings season, insider trading volumes remain light.
Figure 3. InsiderScore Entire Market/ weekly
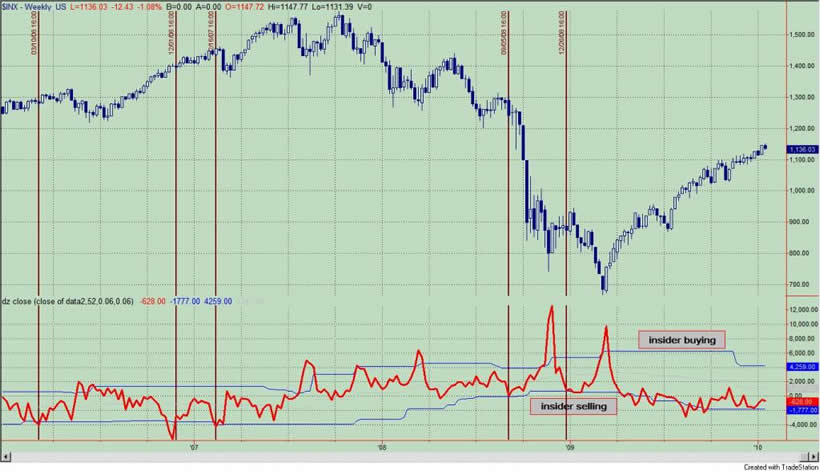
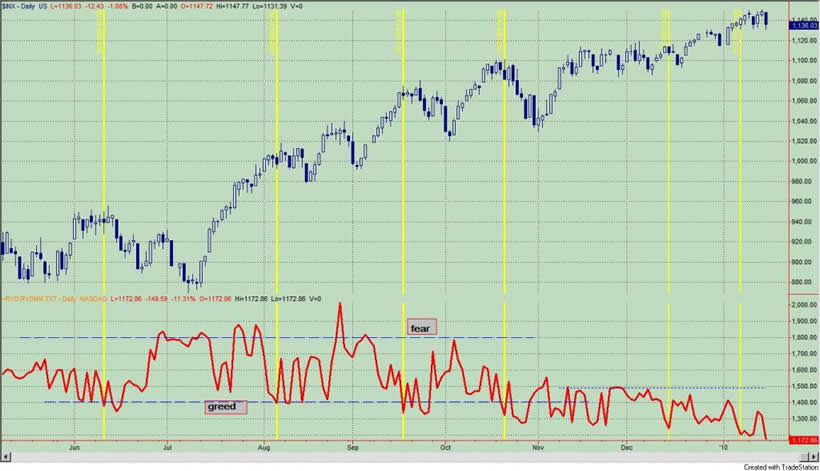
Figure 4 is a daily chart of the S&P500 with the amount of assets in the Rydex Money Market Fund. When the value is low, investors are fully invested and remain complacent; when the value is high, investors are fearful and seeking safety of the money market fund. The current value is the lowest value since the March, 2009 rally began.
Figure 4. S&P500/ Rydex Money Market Fund/ daily
By Guy Lerner
http://thetechnicaltakedotcom.blogspot.com/
Guy M. Lerner, MD is the founder of ARL Advisers, LLC and managing partner of ARL Investment Partners, L.P. Dr. Lerner utilizes a research driven approach to determine those factors which lead to sustainable moves in the markets. He has developed many proprietary tools and trading models in his quest to outperform. Over the past four years, Lerner has shared his innovative approach with the readers of RealMoney.com and TheStreet.com as a featured columnist. He has been a regular guest on the Money Man Radio Show, DEX-TV, routinely published in the some of the most widely-read financial publications and has been a marquee speaker at financial seminars around the world.
© 2010 Copyright Guy Lerner - All Rights Reserved
Disclaimer: The above is a matter of opinion provided for general information purposes only and is not intended as investment advice. Information and analysis above are derived from sources and utilising methods believed to be reliable, but we cannot accept responsibility for any losses you may incur as a result of this analysis. Individuals should consult with their personal financial advisors.
Guy Lerner Archive |
© 2005-2022 http://www.MarketOracle.co.uk - The Market Oracle is a FREE Daily Financial Markets Analysis & Forecasting online publication.