Chinese Dragon Rattles Commodities, Gold, Stocks and Brazil
Commodities / Financial Markets 2010 Jan 22, 2010 - 08:10 AM GMTBy: Gary_Dorsch
 Although the US remains the world’s #1 economy it’s increasingly feeling the heat of a Chinese dragon, breathing down its neck. At the beginning of the twenty-first century, the US-economy was eight-times larger than China’s - a decade later the figure was down to four-times. China’s $4.9-trillion economy has already passed Germany’s to become the world’s third largest, and is on course to overtake #2 Japan this year.
China has emerged to become the world’s largest exporter, shipping $1.2-trillion of goods abroad last year, and overtaking Germany, which held the title of world’s biggest exporter since 2002.
 The shift of economic gravity to China last year did not happen by chance. Beijing’s massive intervention transformed its economy into the world’s locomotive, and appears to have made great headway, in loosening its dependence on the health of its major export markets, including the Euro zone, Japan, and the United States.
Beijing’s state-run mouthpiece, the People’s Daily newspaper hailed China’s economic superiority over Western-style capitalism. It boasted about its authoritarian rulers’ ability to make quick decisions and their will to carry them out.
China is at the epicenter of the Asian sphere, and satellites such as South Korea, Hong Kong, Taiwan, India, and Australia, have hitched a ride to the Chinese juggernaut.
Factories employing low-paid workers to assemble iPods, computers, shoes, and toys are leading the boom. China has also passed the US as the world’s largest auto market and producer. Two decades ago, a car industry barely existed in China. Steel output for 2009 is estimated at 565-million tons, up 13% year on year. Excluding China, global steel output fell 23% from the previous year.
While American and European banks were under siege from the global financial crisis, Chinese banks emerged from the turmoil relatively unscathed. Chinese banks were in sound shape, allowing the government’s 4-trillion yuan stimulus plans to be very effective. Because Chinese banks weren’t overleveraged, they were able to move quickly to inject liquidity into the economy, lending an unprecedented 9.6-trillion yuan ($1.4-trillion) last year, equaling about 30% of the economy’s annual output.
 Beijing is now in a stronger position to build new allies, after a China-ASEAN free trade agreement came into effect on January 1st, creating the world’s third-largest free trade bloc, and undermining US influence in South East Asia. The combined population of the free trade bloc is 1.9-billion people with a combined GDP of $6-trillion. Already, the ASEAN countries are providing the raw materials and manufacturing parts for assembly hubs operating in China. According to the Asian Development Bank, about 60% of China-ASEAN made goods end up in European, Japanese, and US markets.
Japan and South Korea are more reliant on trade and investment with China, - now their largest trading partner. Shanghai and Schenzen has overtaken Tokyo as the world’s second-largest stock market by value. Four Chinese companies are among the 10 biggest by market value. Toyota Motor is the top-ranked Japanese company, at #25, worth about one third the capitalization of Petro-China, the world’s #1 ranked company.
Last year, the big surprise was the degree to which China’s economy was able to rebound from the throes of the “Great Recession.” Its industrial production was up 18.5% from a year ago, and imports rebounded to an all-time high of $112-billion in December, reflecting massive stockpiling of key commodities. Iron-ore imports surged 42% from a year earlier, imports of copper up 63%, and aluminum up 164-percent. China also imported a record 5-million barrels per day of crude oil in December, and has lined up more crude from Kuwait, Saudi Arabia, and Iraq for this year.
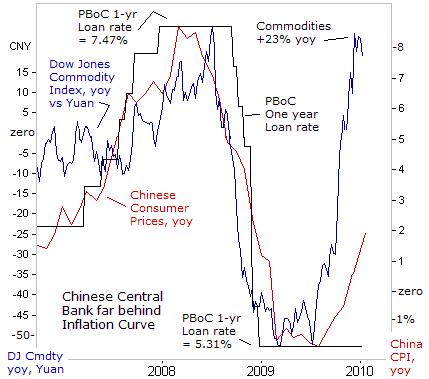
However, for every action there is usually a reaction popping-up somewhere. In China’s case, its massive buying spree for key commodities was also joined by speculators, hopping on the bandwagon, and fueling a rapid escalation of prices since July. This is caused a dilemma for the People’s Bank of China, (PBoC), which finds itself far behind the “inflation curve.” The Dow Jones Commodity Index, measured in Chinese yuan, has made a stunning U-turn, rebounding sharply from an annualized rate of decline of -52% in July 2009, to positive inflation rate of +23% today. In turn, the Chinese CPI was +1.9% higher in December than a year earlier, driven by a 5% rise in food prices.
 PBoC economists are worried that the consumer price deflation experienced through most of 2009, is quickly flipping to escalating inflation in 2010. If the PBoC doesn’t tighten its monetary policy, consumer price inflation could easily accelerate at a +6% clip in 2010. With food and energy accounting for half of China’s consumer price basket, soaring commodity prices are a ticking time bomb. Social unrest is the main reason why the Chinese ruling authorities worry about inflation.
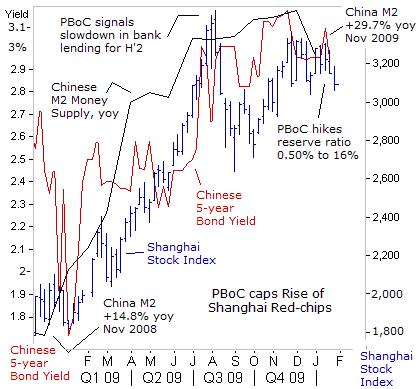
So it’s was of great interest to commodity traders, on Jan 12th when the PBOC, one of the world’s most influential central banks, took a meaningful step to tighten its money spigots and shakeout speculators. After learning that China’s exports and imports had recovered to their pre-crisis levels, the PBoC raised the percentage of deposits that local banks must set aside as reserves by 50-basis points to 16-percent. Adjusting bank reserve ratios is the PBoC’s primary tool for fine-tuning its monetary policy. The higher the reserve requirement, - the less capital a bank has available for lending. With less yuan to lend, the growth of the M2 money supply should contract.
But will this baby-step maneuver by the PBoC to slow its money supply be enough to slow China’s torrid economic growth, and moderate its voracious demand for industrial commodities? A half-point rate hike isn’t significant. Nowadays, when a central bank decides to tighten the money spigots, it usually does so gradually, in baby-steps, in order to avoid sharp meltdowns in the local stock market, - especially if a bubble has been incubating or brewing for many months.
The initial move on Jan 12th to hike reserve ratios to 16%, barely caused a ripple in the Shanghai red-chip index. Chinese banks had already lent 1.1-trillion yuan ($161-billion) in the first half of January alone, far outpacing the government’s full-year target of 7.5-trillon yuan in new loans, buoying asset markets. But on Jan 20th, Beijing upped the stakes in its gambit to slow the M2 money supply, by ordering a near total clampdown on new lending by China’s biggest banks, for the remainder of January.
Within minutes, the Shanghai stock market plunged 3% in afternoon trading to close at 3,150, on speculation the PBoC might also decide to hike its benchmark 1-year loan rate. The Chinese stock market has been building a topping pattern on the charts, since August 2009, when Beijing first signaled a slowdown in bank lending for the second half of last year. Due to fears about the PBOC tightening the liquidity spigot, Shanghai has been the worst performer among the world’s top-10 stock markets this year.
Nightmares over PBoC Tightening in 2007-08,
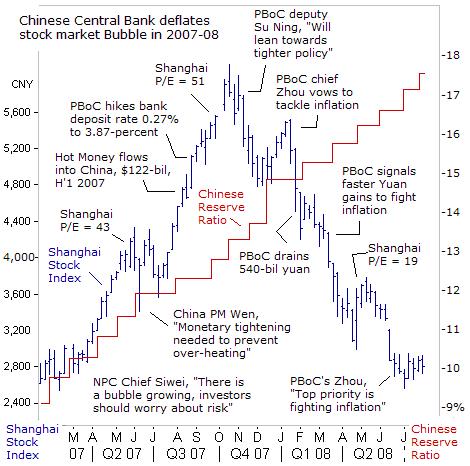 The latest clampdown on Chinese bank lending has already begun to stir-up nightmares about the most brutal tightening campaign in China’s history. A long string of PBoC increases in bank reserve ratios from 9% in January 2007, and extending to a record high of 17.5% by June 2008, and is still etched in the memories of many traders. The PBoC’s tightening campaign included open market operations, draining huge volumes of yuan out the Shanghai money markets, and lifting bank lending rates.
In the early stages of the PBoC’s tightening campaign in 2007, bullish traders reckoned that each increase in bank reserve ratios would be the last, and continued to feverishly bid-up Shanghai red-chips into the stratosphere. While the Chinese H-share index in Hong Kong had risen 10% in H’1, 2007, it lagged a 57% run-up in the Shanghai index, with no arbitrage mechanism allowing traders to narrow the price gap.
At the peak of Shanghai red-chip rally in October 2007, the PBoC reacted by lifting its reserve ratio to 13-percent. Yi Gang, deputy of the PBoC warned speculators that its sole focus was on containing consumer prices. “The central bank has a firm determination to keep inflation in check. We have many tools in our toolbox, including raising reserve requirements, interest rates, and also open market operations. We will make comprehensive use of these tools to fight against inflation and to keep growth in prices and the economy stable,” Yi added.
Yi said the stock market, though important, took a back seat when the PBoC debated whether to tighten policy. “We are paying keen attention to asset prices, but they are not the decisive factor when determining macro-economic control measures. We are mainly concerned with inflation, which in China mainly means CPI,” Yi said. As the PBoC lifted reserve ratios to an all-time high of 17.5%, and hiked its one-year loan rate to 7.47-percent, the bear market in Chinese red-chips deepened.
China’s Politburo has demonstrated its mastery over its currency, bonds, stock market, and economy, especially its ability to deflate and re-inflate bubbles. By remote control, Beijing pulls the levers through “Jawboning,” and direct intervention, to move markets in its desired direction. Now, the Politburo seeks to weaken industrial commodity prices, which must be imported from abroad, and are subject to volatile price swings.
Beijing Engineers Shakeout of Commodity Speculators,
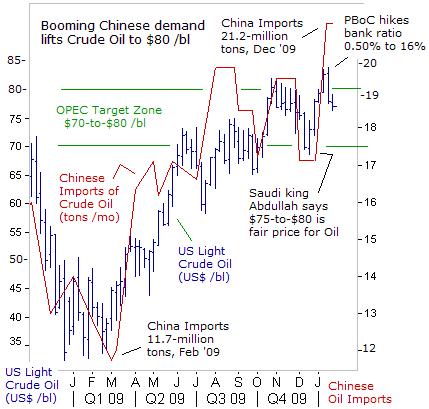 In an eerie sense of déjà vu, the PBoC was once again, facing an outbreak of inflation in 2010, fueled by an upsurge in commodity markets. Curiously enough, the PBoC’s latest tightening moves coincided with an attempt by speculators to push the price of crude oil above $80 /barrel. China itself is partly responsible for the upward surge in world oil prices - its oil imports averaged 5-million barrels /day (bpd) in December, and for all of 2009, imports totaled 203-million tons, up 14% from a year ago.
About 12.7-million autos were sold in China last year, up 44% from the previous year, after Beijing cut taxes on small cars and spent $730 million on subsidies to encourage sales of SUV’s, pickups and minivans. With so many more gas guzzlers set to hit the roads in China in 2010, the International Energy Agency predicted on Jan 15th, global oil demand this year will reach 86.3-million bpd, the highest level since 2007, with rising consumption led by faster growth in emerging economies in Asia.
The OPEC cartel says it’s happy with crude oil gyrating within a range between $70-to $80 /barrel. “I do not think an action to increase production will happen unless the price reaches $100 /barrel,” said Shokri Ghanem, chief of Libya’s National Oil Corporation, on Jan 13th. However, it was the PBoC which prevented crude oil form spiraling upward towards $100 /bl, by tweaking its monetary policy. Crude oil has since tumbled $6 /barrel toward $76 /barrel, amid a shakeout of speculative positions.
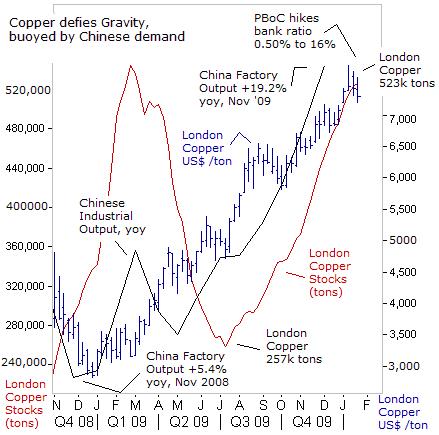
Copper, the metal with a PhD in economics, has defied the textbook logic of supply and demand. Copper has soared 150% from a year ago, even though inventories in London Metal Exchange warehouses have more than doubled to 526,650-tons, levels last seen in the middle of July, and the highest in 10-months. Instead, the price of copper has surged alongside a boom in China’s industrial production, and its stockpiling for the nation’s strategic reserves. China is the biggest player in the market, estimated to buy 35% of the global copper supply of 19-million tons this year.
Threats of labor upheaval at key copper mines in Chile and elsewhere have also served to spike copper higher in December. However, Chile’s Mining Minister Santiago Gonzalez warned on Jan 11th, that speculators have lifted copper prices above their fundamental justifications. “We are worried that copper stock levels are climbing higher. We are at 700,000-tons worldwide at the moment, while prices remain high. This means that at any minute, we could see a violent change and prices could fall,” Gonzalez said.
“Chile is closely monitoring the disparity between prices and stocks, which are the most out of step in the last 20-years,” Gonzalez added. Also weighing on the Chile’s state-owned Codelco, the world’s top copper miner said it boosted its annual output to 1.7-million tons last year, signaling ample global supply. The day after Gonzalez warned of a sharp correction, Beijing tightened its money spigots, knocking copper 3% lower.
Beijing Takes aim at Gold market,
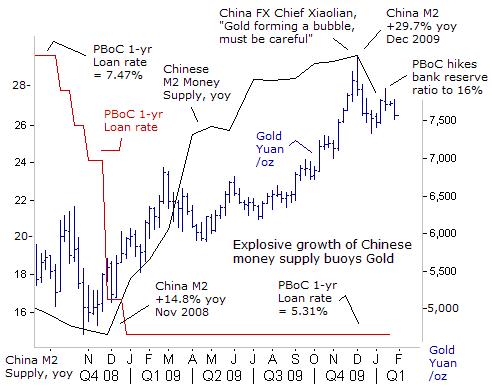 In order to engineer a powerful economic recovery, Beijing doubled the growth rate of the M2 money supply to a 29.7% annualized clip, while slashing its one-year loan rate 216-basis points to 5.31-percent. The explosive growth of China’s money supply, helped fuel gold’s year-long rally in Shanghai to a record 8,370-yuan /oz. China has overtaken India as the world’s largest buyer of the yellow metal, purchasing 450-tons last year, while India’s purchases plunged to 210-tons. The Middle Kingdom also surpassed South Africa and the US as the world’s largest gold miner, and much of the new mint may well be sitting in Beijing’s coffers.
Thus, any move by the PBoC to slow M2’s rate of expansion, should be of great interest to precious metal traders. On Dec 30th, Yu Xuejun, chief bank regulator of the Jiangsu province, said China’s top leaders have charted out policies for the year ahead. “Actual money supply growth for 2010 will be controlled below 20%, and the 17% growth target will be implemented seriously. Asset bubbles and inflation caused by excessive liquidity would be China’s main economic concerns,” Yu warned.
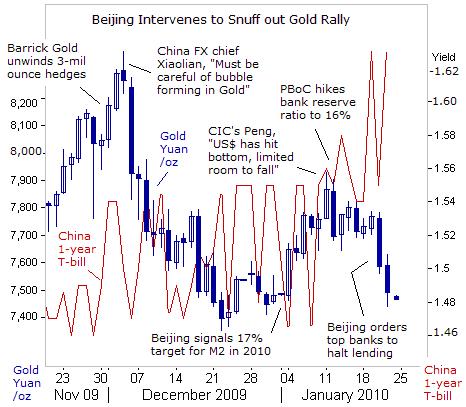
China’s leaders were alarmed by the parabolic surge in gold prices in December, a symbolic sign of inflationary fears spiraling out of control. Beijing has taken aim at the yellow metal, with a mixture of “Jawboning” and tweaking of interest rates. On Dec 2nd, while gold hit record highs at $1,216 /oz in Europe, Hu Xiaolian, FX chief at the People’s Bank of China, told reporters in Taipei, “We must watch out for bubbles forming on certain assets, and be careful in those areas. We must keep in mind the long-term when considering how to use our reserves,” he said.
 As fate would have it, Xiaolian’s comments coincided with the peak in the gold market, - skidding more than 10% over the next three-weeks to 7400-yuan /oz. A recovery rally to 7,900-yuan was stalled by Peng Junming, asset allocator for China’s Investment Corp (CIC). “China should have the right attitude about investing in gold. There is no urgent need for China to increase gold buying for now, because prices are high,” Peng warned on Jan 12th. “I think the US-dollar is at its bottom now. There will be very limited space for the dollar to drop further,” Peng added. A few hours later, the PBoC tightened its monetary policy, and carefully guided the 1-year T-bill rate 13-basis points higher to 1.63-percent. Gold plummeted again to 7,400-yuan /oz.
China’s economy expanded at a 10.7% annualized rate in the fourth quarter, and retail sales in December were 17.5% higher than a year ago. However, about of quarter of last year’s new loans were siphoned into the Shanghai stock market, and speculators in real estate took out mortgages at record levels. Developers were snapping up land, and the banks were eagerly funding them. In Shanghai, prices for high-end real estate were up 54% through September, to $500 /square foot. In November alone, housing prices in 70 major cities jumped 5.7%, while housing starts soared 194-percent.
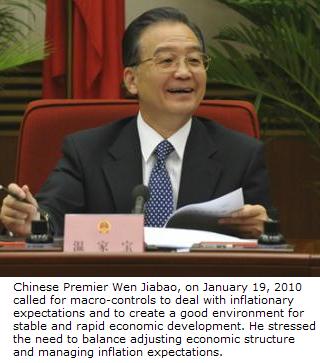
The real estate binge is fueling fears of a US-style bubble that could burst, and once the bubble pops, China’s economic growth could be badly impaired. China Premier Wen Jiabao told the Xinhua on Dec 27th, that “property prices have risen too quickly,” and pledged a crackdown on speculators. Thus, Beijing must tweak its monetary policy carefully, “The government must strengthen macro-economic control and carefully handle managing inflation expectations,” PM Wen warned on January 20th.
However, “To withdraw macro-economic policies too early will likely ruin the efforts made before and reverse the economic development,” Wen added. Thus, in weaning the Chinese economy off its addiction to high powered liquidity, the PBoC is expected to gradually withdraw the stimulus in the months ahead. IMF chief Strauss-Kahn advised that countries around the world shouldn’t unwind their stimulus measures abruptly. “If we remove stimulus too early, there’s risk to a double-dip slump.
PBoC Rattles Brazil, Unwinds US$ “Carry Trade,”
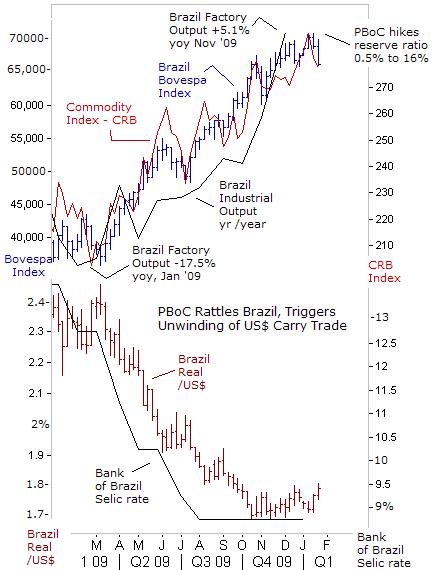 Although Brazil’s central bank might keep its benchmark Selic interest rate steady at 8.75% on Jan 29th, the next shift in policy is expected towards higher interest rates. Last year, the Bank of Brazil (BoB) slashed its Selic rate by 500 basis points to re-invigorate it faltering economy. Brazil quickly rebounded from a six-month recession in Q’2, ahead of the G-7 economies. Brazil created payroll jobs in November for a tenth straight month, recouping nearly all its job losses from the “Great Recession.”
Foreign inflows to Brazil totaled $28.7-billion in 2009. In order to defend the US-dollar from spiraling lower, the BoB bought $24-billion on the spot foreign exchange market. BoB rate cuts were also designed to cushion the dollar’s sharp slide against the Brazilian real. Yet in a virtuous cycle, sharply lower interest rates added more fuel to the Ballistic Brazilian Bovespa Index, which gained +80% last year. The US-dollar finally found support near 1.70-reals in the fourth quarter, after losing 30-percent.
China became Brazil’s top trading partner, displacing the US, which had been Brazil’s biggest trading partner since the 1930’s. Soybeans account for a third Brazil’s exports to China, iron ore 25%, and petroleum, 10-percent. Thus, faster growth in China, the world’s biggest importer of soybean and iron ore, boosted demand for Brazil’s commodities, and buoyed its trade surplus. China has been gobbling up US stocks of soybeans at a near-record pace, but new global supplies are weighing on prices.
Bumper crops from the United States and Argentina have knocked Chicago soybean futures about 10% lower in January. The USDA said global soy production for Brazil, the #2 producer, should increase to a record 65-million tons. Brazil’s soy exports hit a record high of 28.5-million tons in 2009. Argentina, the third-largest producer, should see production recover to 53-million tons, up 66% from last year. Weaker soybean prices could shrink Brazil’s trade surplus, and undermine its currency.
Operators in the Emerging markets, such as Brazil’s Bovespa, are spooked by the prospect of a extended tightening campaign in China, especially if the ruling authorities live up to their threats to slow the M2 money supply to 17-percent. That could slow China’s growth rate towards 8% and weaken demand for key industrial commodities, such iron ore controlled by Brazil’s miner Vale-Rio-Doce and oil pumped by Petrobras, which together account for nearly 40% of the Bovespa’s weighting.
Although Brazil is expected to hike its Selic rate this year, it might not support the Brazilian real against the US-dollar. Instead, a slide in the Brazilian and Chinese stock markets could ignite panic sales of Bovespa shares, which in turn, could snowball into the unwinding of US-dollar carry trades. As traders dump Bovespa shares, and repay US-dollar margin loans, the US-dollar could climb higher by default.
By Gary Dorsch,
Editor, Global Money Trends newsletter
http://www.sirchartsalot.com
GMT filters important news and information into (1) bullet-point, easy to understand analysis, (2) featuring "Inter-Market Technical Analysis" that visually displays the dynamic inter-relationships between foreign currencies, commodities, interest rates and the stock markets from a dozen key countries around the world. Also included are (3) charts of key economic statistics of foreign countries that move markets.
Subscribers can also listen to bi-weekly Audio Broadcasts, with the latest news on global markets, and view our updated model portfolio 2008. To order a subscription to Global Money Trends, click on the hyperlink below, http://www.sirchartsalot.com/newsletters.php or call toll free to order, Sunday thru Thursday, 8 am to 9 pm EST, and on Friday 8 am to 5 pm, at 866-553-1007. Outside the call 561-367-1007.
Mr Dorsch worked on the trading floor of the Chicago Mercantile Exchange for nine years as the chief Financial Futures Analyst for three clearing firms, Oppenheimer Rouse Futures Inc, GH Miller and Company, and a commodity fund at the LNS Financial Group.
As a transactional broker for Charles Schwab's Global Investment Services department, Mr Dorsch handled thousands of customer trades in 45 stock exchanges around the world, including Australia, Canada, Japan, Hong Kong, the Euro zone, London, Toronto, South Africa, Mexico, and New Zealand, and Canadian oil trusts, ADR's and Exchange Traded Funds.
He wrote a weekly newsletter from 2000 thru September 2005 called, "Foreign Currency Trends" for Charles Schwab's Global Investment department, featuring inter-market technical analysis, to understand the dynamic inter-relationships between the foreign exchange, global bond and stock markets, and key industrial commodities.
Copyright © 2005-2010 SirChartsAlot, Inc. All rights reserved.
Disclaimer: SirChartsAlot.com's analysis and insights are based upon data gathered by it from various sources believed to be reliable, complete and accurate. However, no guarantee is made by SirChartsAlot.com as to the reliability, completeness and accuracy of the data so analyzed. SirChartsAlot.com is in the business of gathering information, analyzing it and disseminating the analysis for informational and educational purposes only. SirChartsAlot.com attempts to analyze trends, not make recommendations. All statements and expressions are the opinion of SirChartsAlot.com and are not meant to be investment advice or solicitation or recommendation to establish market positions. Our opinions are subject to change without notice. SirChartsAlot.com strongly advises readers to conduct thorough research relevant to decisions and verify facts from various independent sources.
Gary Dorsch Archive |
© 2005-2022 http://www.MarketOracle.co.uk - The Market Oracle is a FREE Daily Financial Markets Analysis & Forecasting online publication.


