Gold Is Going Nowhere But Up
Commodities / Gold and Silver 2010 Jan 28, 2010 - 12:09 AM GMTBy: Submissions
 Joshua Burnett writes: My father-in-law recently set me an article which was published in the Money section of CNN under the title: “Beware The 4 New Asset Bubbles,” written by Shawn Tully, senior editor at large at Fortune. Mr. Tully contends that there are four new balloons in the economy: Treasuries, oil, gold, and stocks. Since my father-in-law was primarily concerned with gold let’s look at that.
The “Historic Average” of Gold
Mr. Tully makes several claims concerning gold. His first indirect statement address all four items: “They’ve already seen huge run-ups that put their prices far above their historic averages, and far above the levels justified by fundamentals.” Au contraire, messieur.
Gold peaked at $850 in January of 1980; a simple adjustment for inflation puts that valuation at $2,193.25 in 2008 dollars (gold peaked at $1,212.50 in December of 2009 making it only 55% of its 1980 peak). The average price of gold in 1980 was $612.56, or $1,580.59 in 2008 dollars; 1981 saw an average of $460.03, or $1,076.17 in 2008 dollars. The “year of the all time high” in 2009 still only saw an annual average of $972.35 (two other years came to within $75 [inflation adjusted] of 2009’s average: 1979 [$898.15] & 1983 [$905.40]).
What I just listed proves two things: first, that gold has seen prices of double what we’re seeing now. Second, it shows that gold held averages for two years that exceed the current price of gold and two more years that rival its recent price. What these statistics don’t do is directly refute Mr. Tully’s argument that gold is priced “far above (its) historic average.” The reason for that is two-fold.
Gold’s “historic average” is a rather nebulous concept. As obvious as it sounds gold has only been valued in dollars since 1792, although it was used as a money metal for millennia before that. We can reasonably assume the historical averages Mr. Tully speaks of refer to history made since that time. The Coinage Act of 1792 defined the relative values of gold & silver; the dollar was legally bound to gold at the rate of $20.67 per ounce; something oft referred to as a “gold standard,” i.e. a concrete anchor of a fiat currency to a precious metal. I think it would also be prudent to assume that we can’t count these years into gold’s “historic average” since the dollar was tied to gold at a fixed rate. This lasted until 1933, when FDR revalued gold to $35.00 an ounce; he simultaneously made it illegal to own; this wasn’t repealed until December 31st, 1974, making 1975 the first year one could legally own gold which wasn’t tied to the dollar at a fixed rate (Nixon took us off the gold standard in 1971). So now we’ve narrowed the possibility of any “historical average” which Mr. Tully could be referring to from approximately 6,000 years of recorded human history to the last 34.
Gold has somewhat of an inverse relationship with the economy; because of its (rightly deserved) reputation as a stable store of value it traditionally doesn’t make for a great investment. An “investment,” by definition, is something you put money into to watch it grow at the risk of it being lost. A “store of value,” conversely, is something you put money into to keep it from being lost, knowing it probably won’t increase. Because of this anyone who put money in gold from 1975 until around 2000 either wasn’t a smart investor or they weren’t looking to invest at all. Gold is something people tend to turn to when inflation rears its ugly head; id est why gold peaked at its highest in 1979-1981 when inflation was in the double digits. These 34 years of history were some of the most prosperous in our nation’s history; the Dow went from 650 points in January 1975 to over 14,000 in 2007; an increase of approximately 2,150 percent.
The first reason that Mr. Tully can argue that gold is priced far above its historic average is that for the first 5,800 years of history it wasn’t valued in dollars, for the next 141 years the dollar was tied to gold at a set price of $20.67 per ounce, and for 41 years after that it was illegal to own (and therefore protected from American market fluctuation). This is to say that whenever you claim 6,000 years of history and only utilize 34 years of data it’s rather difficult to draw an accurate conclusion. The second reason for this claim is that gold simply wasn’t a good investment when the stock market was booming; who wants to put his money in a solid store of value when he can actually invest and make 10% and 12% per year on a conservative basis?
Fixed vs. Stable
The author discusses how investors are trending towards gold now because of the rotten macro economic fundamentals in the market that all point towards heavy increases in inflation; many (including myself) believe we’re on the verge of hyperinflation. Bubble or no, that makes anything locked into dollars a bad investment (e.g. treasuries, outlined earlier in his article). Mr. Tully argues that the reason gold bugs so adamantly argue for the yellow metal is that “they claim (it) has a fixed supply.”
I’ve been interacting with gold bugs on a regular basis for a year and a half now and I have yet to hear a single one make that claim. I’ve been reading research and speculation that has been written over the past forty years and have yet to see that in writing until this article. What Mr. Tully has set up for his straw man is a misconstruction of the argument that the gold supply is stable, not fixed. You see, unlike dollars, gold does have a fixed supply… on earth. There’s only so much of it in existence, and as alchemists proved by centuries of failure it cannot be re-created. Contrast this to fiat currencies which can be printed, or far more subtly now, be created with a few keystrokes.
This makes dollars anything but stable, and gold the definition of it.
Gold supply is stable for many more reasons. One is that it typically takes between 7 and 10 years to open a new mine which makes fresh metal supply somewhat predictable. Another argument for stability of the yellow metal revolves around its primary uses. Gold has three: investment (generally in bullion or coins), industrial consumables, and jewelry. Of these three only industrial uses tend to be consumed and most industries have recycling programs in place to re-utilize what they can of this used gold. Industrial demand also tends to be pretty consistent and fluctuates only with demand for the particular products made utilizing gold; that is to say that gold is used in the industrial applications because of its peculiar properties; manufacturers can’t turn to another metal when gold gets too pricey or another metal becomes extremely cheap. This makes the industrial demand for gold very consistent and the industrial sector as stable as the surrounding economy (whether you consider that to be actually stable or not is a determination for you to make on an individual basis).
Effect of Investor Demand
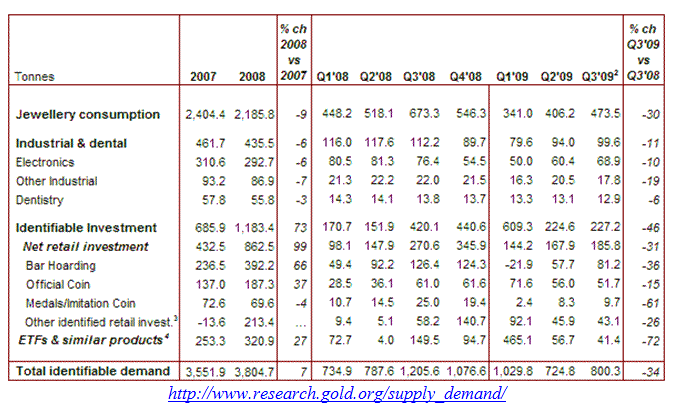
Jewelry demand tends to fluctuate with disposable cash; this is why we saw a 9% drop in gold jewelry demand from 2007 to 2008 and approximately 25% decrease from 2008 to 2009.

What occurred simultaneously was a 72.5% increase in gold investment demand from 2007 to 2008 as investors fled the stock market and sought refuge in gold. The next year experienced even more of the same as investment demand in the first 3 quarters of 2009 saw an increase of 30% over the same time period in 2008. A micro economist might want to stop here and claim that this increased demand accounted for the increased price of gold. Not so fast; let’s dig a bit further.
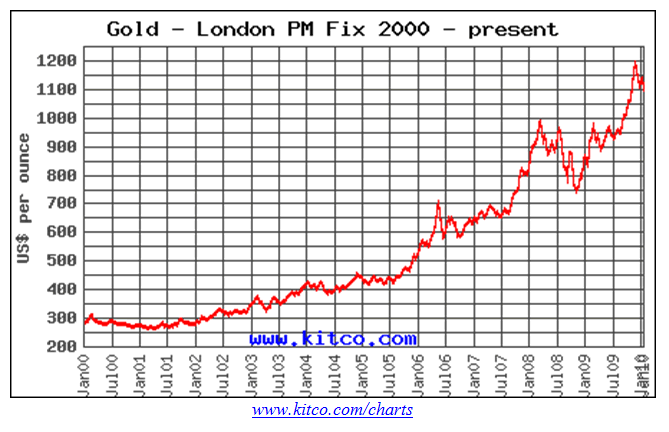
A quick visit to the historical charts section of Kitco.com demonstrates that gold has been steadily on the rise since July of 2001; averaging 14.4% increase annually from 2001-2007, the seven years before we saw huge jumps of investors from the stock market to the gold market.

2007-2008 increases were 20.3% and 2008-2009 increases were 10.4% for a two year average of 15.35%; meaning that even when the investment market more than doubled over the same two year period, all of this increased demand correlated to an increased price gain of less than 1%. Incidentally the increase from 2004-2005 was 26.4% (greater than even 07-08) and five of the six years from 2001-2007 saw increases greater than those seen from 2008-2009. What does this mean? The gold market is moving independently of investment demand and industry supply.
The Threat of Private Gold Influx
This in and of itself is enough to disprove the claims that Mr. Tully makes in his article, but he’s got one more laughable arrow to let fly. After mentioning that gold mines “are investing heavily to increase production” he writes this: “The real threat: Prices are so high all over the world that people who once treasured their gold jewelry are now rushing to sell it. Swiss refiners are offering irresistible prices for bracelets and brooches, "cash-for-gold" stores are in Chicago malls, and suburbanites are hosting Tupperware-style parties where neighbors show up to hock their gold teeth.”
Yes, gold mining companies the world over are ramping up production to meet this incredible demand. But the real threat, the real threat to this incredible upswing in price is your neighbor’s gold teeth which he sells to Cash4Gold at a Tupperware-style house party. Say your prayers to the tooth fairy each night, hoping that Dwayne Johnson will take the wrong teeth and leave your neighbors without their massive oral stockpiles.
I’m sorry, Mr. Tully. I had to have my bit of fun. You must admit you left yourself hanging out there. Seriously now, increased selling of gold could theoretically introduce a rather large resource pool into the investment market as it has traditionally accounted for approximately two/thirds of demand worldwide. This theory, however, has several problems. First, once gold is mined into jewelry it moves from the world of intrinsic value to that of abstract value. Much of the price of a piece of jewelry is its design & manufacture costs combined with profit markup; it’s possible that as little as a quarter of what you’re paying for is the actual value of the metal. This means that the price of gold would have to double to quadruple from when you bought your ring simply to recoup your costs. Add to that the fact that most gold jewelry is sentimental to some degree and few people have enough disposable gold to even bother with the hassle of selling it (name all of the people you know who own more gold than a wedding ring).
The article attempts to correlate the current gold “harvesting” attempts (e.g. Cash4Gold) with the silver harvesting efforts of the late 1970s although several problems exist with this. The first is that this influx of private metal didn’t happen with gold… it happened with silver.
Although the two are related they’re different commodities with different governing principles and market fundamentals altogether; it’s like making a marketing projection about how Toyota will perform in the future solely based on Ford’s past. “Wait, wait, wait,” you say. “Didn’t you tell us earlier that gold was illegal to own until 1974? Doesn’t this mean that people only had five years to accumulate gold, and therefore there wouldn’t be enough in private ownership to sell?” I did mention Roosevelt’s Executive Order 1602 earlier; it required all private citizens to surrender all gold but specifically exempted “customary use in industry, profession or art,” a provision that excluded jewelry, art, and yes Mr. Tully, your vaunted gold teeth. This means that the private supply of non-investment related gold (the exact field Mr. Tully finds so threatening) was left alone.
There weren’t massive lines of people carrying old gold jewelry into salvage centers; this was really only seen with silver; this despite the fact that between 1971 and 1979 the price of gold (annual average) had increased 752%. By the next year gold had increased a total of 1,500% (annual average) with spikes as high as 2,273% since the metals bull began, and people still weren’t lining up to sell gold! The highest spike in the current bull market has only reached 473%; increase on the annual averages is only 359%. Assuming the same trend we would have to reach $5,817.74 to equal the same percentage spike seen from 1971-1980 in the current bull market, and even then people weren’t selling en masse. Perhaps psychological fundamentals are different today; perhaps people are willing to sell much earlier. Even assuming a 50% decrease on the above projection we shouldn’t see large scale private gold infusions until gold hits the $2,900 range. I think it’s safe to say we won’t see that in the $1,100 range we’re seeing now.
The silver bull market did see mass selling of private silver, but the market spike over the same period of time hit 3,558% with an increase on the annual average of $1,176%. Even if we assume the market fundamentals for gold and silver are the same (which they’re not) gold would still have to spike to a minimum of more than $3,000.
Silver Market Conditions in 1980
So what about market conditions? Mr. Tully attempts to make a correlation between silver’s rapid price decline in 1980 to gold’s current rise today. To do so is to create a false analogy as the market conditions are very dissimilar. In the 1970’s the Hunt family (quite possible the wealthiest family in America at the time) began to purchase precious metals as a hedge against inflation; since gold was illegal to own they purchased silver. As the years went by they continued to purchase more and in 1979 formed an international conglomerate that amassed a silver pool of some 200 million ounces, or half of the world’s deliverable supply. Soon thereafter intervention by the Federal Reserve and the New York Metals market precipitated a shift in the market that resulted in a decade long slide. Mr. Tully attempts to paint the picture that this was the result of people selling privately owned silver teapots instead of focusing on the rather large factors of one conglomerate owning half of the world’s silver supply and the all powerful Federal Reserve changing the rules halfway through their ascent.
A quick aside (I can’t resist): several interesting possible historical alternate realities present themselves here. First, what would have happened had we never gone off of the gold standard? The Hunts would have never attempted to protect themselves from inflation (a peculiarity of non-grounded fiat currencies) and would have invested their money and energies elsewhere. What if gold had been legal to own? When you’re investing billions into precious metals it’s generally a better idea to get the most valuable metals, if only for transfer and storage convenience. What would have happened to silver had the Hunts been able to do this? What would have happened had the Fed not intervened? Would the Hunt family have ended up like the De Beers, controlling 90% of a global commodity supply? The possibilities are endless, and they all revolve around the central question: “what would have happened if the market was allowed to operate without government intervention?” Sigh. A libertarian utopia.
Gold & The Dollar
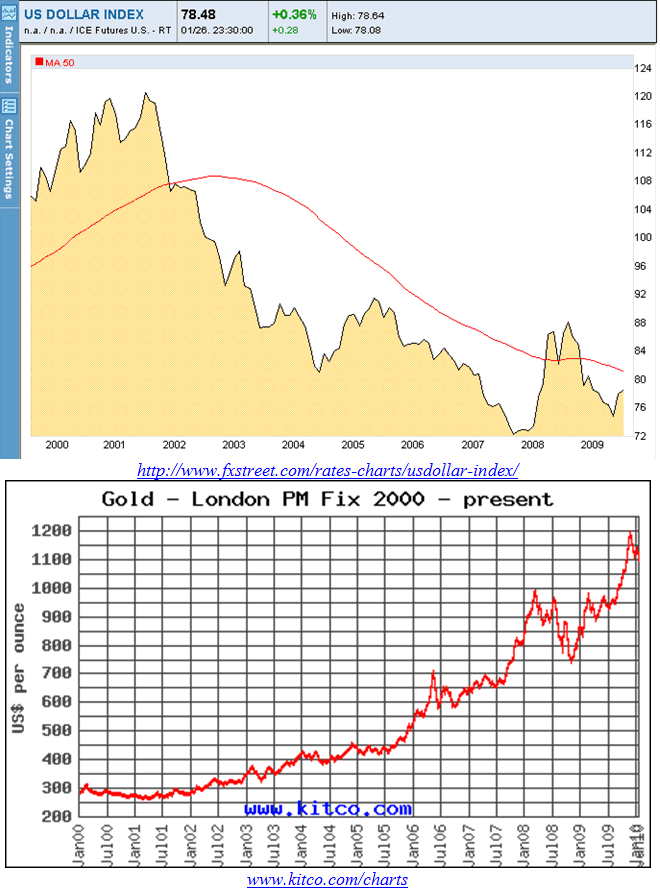
But I digress. Gold is hardly in a bubble as it is moving independently of investors’ best efforts. Gold is merely moving in response to fiat monetary policies in ways that will only become completely apparent with the benefit of hindsight. One way that is immediately apparent is this: gold is a concrete store of value with six millennia of proven track record as a monetary commodity behind it. The dollar, in its current configuration, has only been in existence for 39 years and is a fiat currency in a world where every fiat currency except for those currently in use has failed. Every single one. The first chart below demonstrates the last eight years of the U.S. Dollar Index, measuring the strength of the dollar’s purchasing power. The second chart I used earlier; it illustrates the price of gold as measured in dollars over the same time period.

Notice any similarities? Hint: invert one.
Think of the dollar as an anchor to a financial ship; the anchor hangs down only as far as the chain (i.e. gold’s inherent stability) allows it to. As long as the ship is in waters where the anchor can touch bottom, the financial ship is stable. When the ship ventures into water where the depth is two, three, or ten times greater than the chain is long the gap between the anchor and the bottom of the ocean increases accordingly. Does this mean that the chain is getting shorter? Does the fact that the dollar is inflating tremendously mean that gold is overvalued? The answer to both is no; they’re merely concrete measures to constantly changing stimuli.
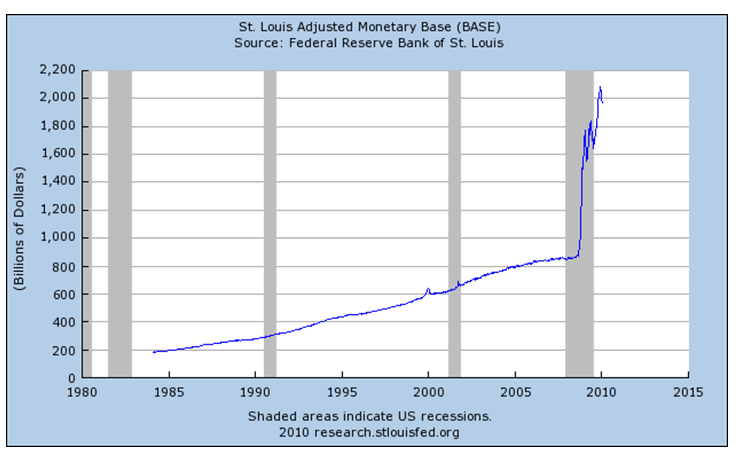
As long as the dollar continues to display self-destructive trends such as the one displayed below (courtesy of the St. Louis Fed) gold will continue to be a safe place to be. It’s not going anywhere…except for up.

2 Numbers calculated from annual gold price averages in USD
3 See chart 1. Q4 2009 data was unavailable so first three quarters were averaged and Q4 data assumed to be the same as the average; this data was compared to 2007 averages displayed on same chart
4 Low in 1971 of $37.39 as compared to high in 1980 of $850.00
5 Start in 2001: low of $255.95. Spike in 2009: $1,212.5
6 Assuming that the spike of gold would merely hit the cumulative annual average increase on silver (i.e. going with the lowest possible projection)
By Josh Burnett
Like this article? Let Josh know by writing him at jburnett85@gmail.com.
© 2010 Copyright Josh Burnett - All Rights Reserved
Disclaimer: The above is a matter of opinion provided for general information purposes only and is not intended as investment advice. Information and analysis above are derived from sources and utilising methods believed to be reliable, but we cannot accept responsibility for any losses you may incur as a result of this analysis. Individuals should consult with their personal financial advisors.
© 2005-2022 http://www.MarketOracle.co.uk - The Market Oracle is a FREE Daily Financial Markets Analysis & Forecasting online publication.


