Copper, Zinc, Nickel... Impact From Soaring Base Metals Stockpiles
Commodities / Metals & Mining Jan 29, 2010 - 11:37 AM GMTBy: Zeal_LLC
 Ever since its secular bull kicked off in 2003, the once-boring base-metals sector took on an aura of excitement. What trader wasn’t excited when copper, zinc, nickel, lead, and aluminum put together respective gains of 475%, 523%, 650%, 829%, and 163% from their 2003 lows to their interim bull-market highs?
A structural shift in base metals’ core fundamentals sent prices skyrocketing, as supply simply wasn’t able to keep up with fast-growing demand. The age of consumption extended well beyond the Western economies that normally drove commodities prices, and an Asian monster was aggressively feeding its voracious appetite for the metals. A new group of developing economies had finally joined the modern era, initiating colossal infrastructure buildouts.
But as is apparent today, base metals prices were rising too far, too fast. And as any knowledgeable trader understands, such a blistering pace is unsustainable. Either supply would catch up to demand, demand would soften, or crazy-high prices would enable a convergence of these two scenarios. And this would balance prices at levels that are fundamentally justified. Base metals prices coming off their lofty highs wouldn’t damage the integrity of their secular bulls, but instead bring order to a bit of speculative excess.
And prices did come off their highs. Zinc saw its high in 2006, nickel and lead in 2007, and copper and aluminum in 2008. Whether consolidation or correction, base metals prices retreated in search of that balance. But thanks to the global economic crisis, downward-moving base metals prices were pushed to the other extreme. As with all assets at the time, they careened into the depths of despair.
Many traders that have tried to game the base metals markets have gotten crushed on both the upside and downside over the last several years. It really has been challenging to find that balance for these wild and wacky base metals. And it seemed like no chart, tool, or model could predict what they were going to do next.
But there has been one tool that has been helpful to traders over the years. And at Zeal we’ve had great success navigating the base metals markets thanks to its unique presentation of fundamental attributes. Technicals alone can only get traders so far, which is why it is always important to stay abreast of what’s happening on the fundamental scene.
The London Metal Exchange (LME), the world’s premier non-ferrous metals exchange, is host to this excellent fundamental data. In addition to being the most reliable source for prices, futures, and options, the LME operates a warehousing and delivery system. It manages over 500 approved warehouses around the world to physically store the base metals. And it is the tracking of this storage, or stockpiles, that feeds us our data.
The LME calls this network of warehouses a market of “last resort” since physical delivery is a very small percentage of its metals trading activity. As described by the LME, its warehouses are utilized to deliver excess stock to in times of oversupply, and as a source of material in times of extreme shortage. And it points out that this delivery system plays a vital role in creating price convergence.
With these stockpile levels updated on a daily basis, traders can integrate the data with daily price activity, plot it on charts, and come away with a hybrid fundamental and technical trading tool. And the resulting charts have been very useful in assisting with trading decisions.
This price convergence acknowledged by the LME really plays off the notions of surplus and scarcity. If stockpiles are rising, it can be implied that supply is outpacing demand. And if such a trend persists, it is natural that a recognized surplus will lead to lower prices. Inversely, if stockpiles are declining it can be implied that supply is falling short of meeting demand. If this trend persists then prices should naturally rise as more capital is chasing after scarcer goods.
Over the last 4 years I’ve chronicled this LME stockpile and price relationship in a series of essays that have analyzed the 5 primary base metals. And this normally reliable tool has been consistent in its reads. But over the last year or so the extreme conditions spawned by the bond and stock panics have really thrown base metals traders off balance. As you can see in these updated charts, a fundamental disconnect is glaringly apparent.
Copper, the most mainstream of the base metals, paints a beautiful picture of what the inverse relationship between LME stockpiles and prices can look like. Over the first 3 years of this chart we can see prices rise and fall based on the tides of LME stockpile levels.
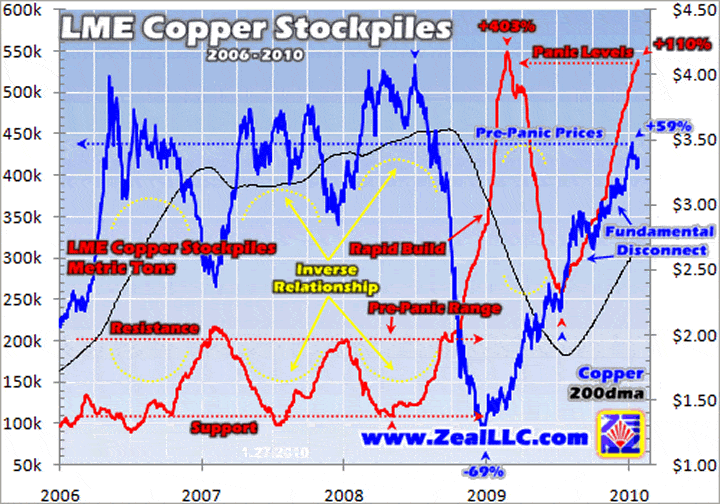
Copper’s meteoric rise in 2006 was a result of rapidly dwindling stockpiles, as demand was well-outpacing what the refiners were able to bring to market. With most mine and scrap supply gobbled up via direct channels, consumers were forced to tap the world’s aboveground inventories to meet their needs.
As recent as 2002 LME copper stockpiles were at 1m metric tons, but rounding the corner into 2005 they had gotten as low as about 50k metric tons. Considering this is the equivalent of only about one day of daily global usage, the markets reacted strongly. With a 90%+ stockpile plunge prices had nowhere to go but up. And up they went! With such alarmingly-low stockpile levels a huge speculative risk premium was placed on copper’s price.
LME copper stockpiles slowly built off their 2004/2005 lows, but for years they levitated in the 100k- to 200k-metric-ton range. At these low levels the risk premium was still affixed to copper’s price. As you can see each time LME stockpiles retreated to support, prices would pop into the upper $3 neighborhood.
Considering that copper had never even seen $2 prior to this bull, these new high prices were exceptional. But with a low-inventory reality, this was the balance where traders were comfortable, and thus what buyers had to pay. It would be interesting to see where prices balanced once the supply/demand gap tightened. And when copper stockpiles commenced a build in the second half of 2008, we would begin to get a feel for this new balance.
As stockpiles headed towards resistance copper’s risk premium was quick to fade. And the subsequent correction, which was very healthy, took copper back under $3. But just as LME stockpile levels were stabilizing at resistance leading into October 2008, the global-economic-crisis-spawned stock panic took the driver’s seat. Copper, along with all commodities, entered into a death-defying downward spiral.
This major crisis, that at the time many thought was the beginning of a neo-Great Depression, froze copper consumption. And this was immediately reflected via rising LME stockpile levels. Copper stockpiles soared at a rapid pace, rising over 400% from 2008’s low to the panic high. And by the time all was said and done, its price had shed 69% off its 2008 high.
Copper was of course violently oversold, and its price recovery commenced in early 2009 even before LME stockpile levels turned the corner. This pre-stockpile-shift recovery was generally accepted by the markets since copper was at 2004 prices. But interestingly, can you guess when copper stockpiles were last above 300k metric tons? Yep, 2004.
By March LME stockpiles began a steady fall off the panic highs, with copper’s price steadily rising off its panic lows. But this renewed inverse relationship we’ve come to know was short-lived, as in July LME stockpiles took an about-face and commenced another sharp build. If this longstanding relationship held true the price of copper would have at least taken a break to consolidate, and given the sharp rise in stockpile levels it should have retreated.
Instead the price of copper kept on rising, and has risen ever since. Since July copper stockpiles have more than doubled and are nearly back to panic levels. And provocatively, the price of copper has soared by 59% over this same period of time. This is a huge fundamental disconnect from the precedent set forth in this coherent relationship. How could the price of copper be back to pre-panic levels with LME stockpiles at panic levels? Has this conundrum thrown a wrench into this once-reliable metric?
This development has indeed added a number of question marks to say the least. And this is no small disconnect on the duration front, now running 7 months. With LME copper stockpiles at 500k+ metric tons, it is obvious that copper is exhibiting interim fundamental weakness and is extremely overbought. But with prices hardly exhibiting weakness, are we seeing a strategic shift in the balance of these markets?
Let’s now take copper out of isolation and see if the other major base metals subscribe to this same trend. And looking at zinc, so far they’re on the same page. Like copper, zinc’s bull gained momentum as rapidly falling stockpiles exposed a structural supply deficit.
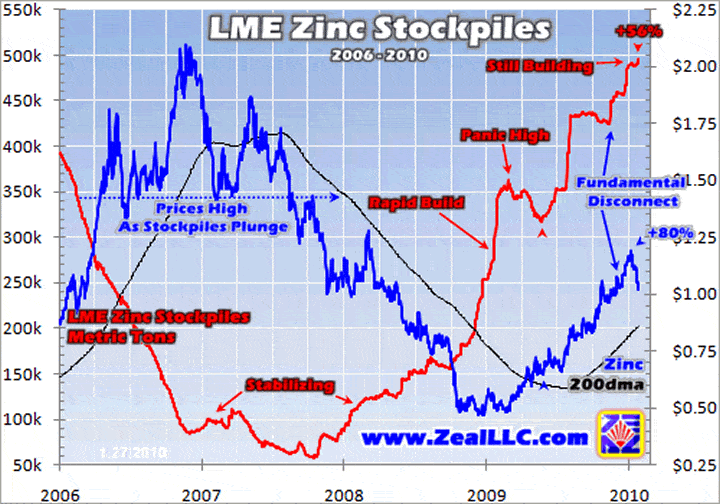
Zinc’s inverse relationship with LME stockpiles isn’t as visually-compelling as copper’s, but it was a strong force in the early going. From 2004 levels around 800k metric tons, LME zinc stockpiles plunged by over 90% in a virtual freefall before finally stabilizing in 2007. This of course sent zinc prices through the roof. In 2006 zinc blasted through $1 and then $2 for the first time ever.
With the equivalent of only about 3 days worth of global zinc usage, futures traders affixed a huge risk premium to its price. But upon stockpile stabilization zinc fell off the right shoulder of a classic head-and-shoulders pattern and entered into a vicious downtrend that didn’t end until the panic had its way with this metal. And like copper, LME zinc stockpiles mounted a rapid build during this panic period.
After the panic high, LME stockpiles retreated for a few months while at the same time zinc’s price commenced a recovery. The inverse relationship was on. But this stockpile retreat was short-lived as warehoused inventories again mounted a build. And this build has taken LME zinc stockpiles well past levels seen at the panic peak.
How did zinc prices respond? Like copper they continued to rise right along with stockpile levels. Now zinc was so oversold, down 77% from its 2006 high, that it did deserve a little wiggle room in its recovery path. But an 80% gain during a span where stockpiles rose 56% is again a major disconnect. The last time LME zinc stockpiles were at 500k metric tons, the price of zinc was well less than what it is today.
Nickel’s story starts the same as copper and zinc, except on steroids. From its 2006 high LME nickel stockpiles fell by over 90% in quick fashion. The result of this pilfering was the equivalent of only about one day worth of global usage. And staying at the 5k-metric-ton level for nearly a year allowed futures traders to have a field day with nickel’s price.
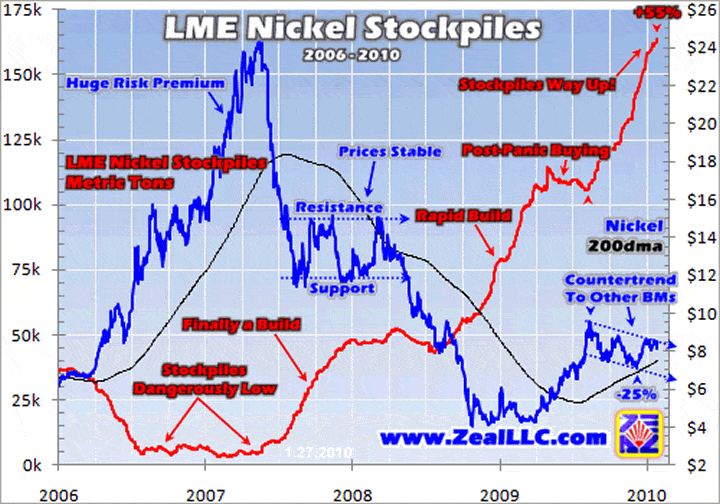
Nickel’s huge risk premium took it past $10 and then $20 for the first time ever. And when LME stockpiles finally commenced a build in 2007, much of this premium was quick to come off. The price of nickel stabilized rounding the corner into 2008 as stockpiles settled around the 50k-metric-ton level. But nickel got sucked into the global commodities correction as 2008 progressed, and its price started to fade even before the stockpiles started to build in the second half of the year.
By the time selling was exhausted, nickel had fallen by a staggering 84%. Like the other base metals LME nickel stockpiles were way up over the course of the panic, and the build didn’t take a breather until April. With stockpile levels stabilizing at this point nickel commenced its recovery, and by August its price had more than doubled. But at this same time in August LME stockpiles changed direction and again mounted a rapid build. But unlike copper and zinc, nickel would heed the call of this fundamental shift.
Nickel traders played the inverse relationship to form and started selling the metal. While the prices of the other base metals continued to rise in parallel with their ongoing stockpile builds, nickel took a different course over the last 5 or so months. As you can see a downtrend has been carved and prices have retreated down to the $8 level.
Interestingly this activity should not be all that surprising given nickel’s stockpile history. LME nickel stockpiles are currently more than double the previous high point since 1998, when the LME started logging daily data. This big nickel oversupply has righteously suppressed its price.
Lead took a bit of a different path in the beginning of its bull. And this path was dictated by its interim fundamentals. LME lead stockpiles had an initial sharp fall from 2002 highs near 200k metric tons, sending its price from bear-market lows of $0.20 to more than a double. But in 2005 and early 2006 when the stockpiles for the other base metals were still falling or flat-lining at lows, lead stockpiles mounted a build.
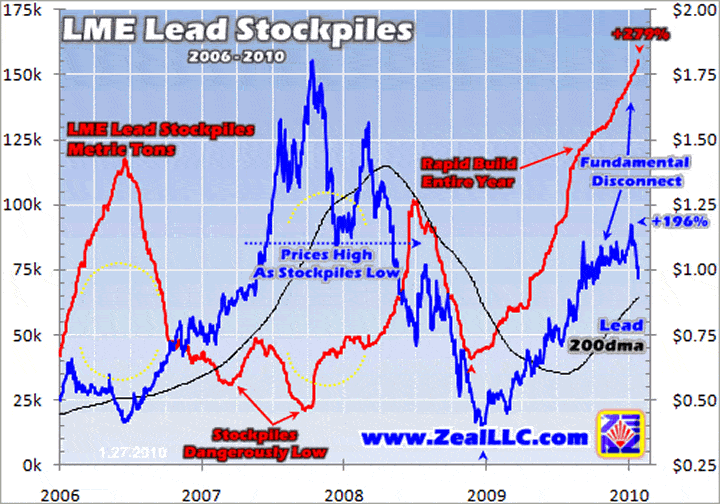
As you can see this move higher to about 120k metric tons gave futures traders little reason to boost lead’s price, and it actually fell in the first half of 2006. But with global average daily usage of about 22k metric tons, even this 120k level (5 days worth) was on shaky ground. And when stockpiles started to fall in the second half of 2006, that low-stockpile risk premium shot lead’s price way higher.
With LME stockpiles falling dangerously low to only a day or two’s worth of usage, and staying there for over a year, lead shattered its all-time highs and climbed well above the $1 mark. Lead stockpiles eventually gained ground in Q2 2008, thus leading to an inverse price movement.
But following this brief stockpile move higher, an uncharacteristic drop in the second half of 2008 occurred. And instead of lead responding with rising prices, it continued to fall into the panic. Lead traders ignored the fundamentals and joined the global selloff.
Eventually lead stockpiles turned higher to follow the rest of the herd, and in 2009 they more than tripled. And what happened with lead’s price is the same old story. A persistent rally defied logic and displayed yet another major disconnect from fundamentals. Even though LME lead stockpiles are at their highest levels since early 2003, traders are unwilling to sell the metal and have been propping up its price as though stockpile levels were much lower.
Aluminum’s story is similar to that of the other base metals. Historically-low stockpile levels led to higher prices. But for a variety of reasons these levels never got as low as the others, which is why aluminum’s gains were not as substantial. One reason for this is aluminum is not as scarce as the other base metals. And its pipeline of development projects is more robust than all the rest.
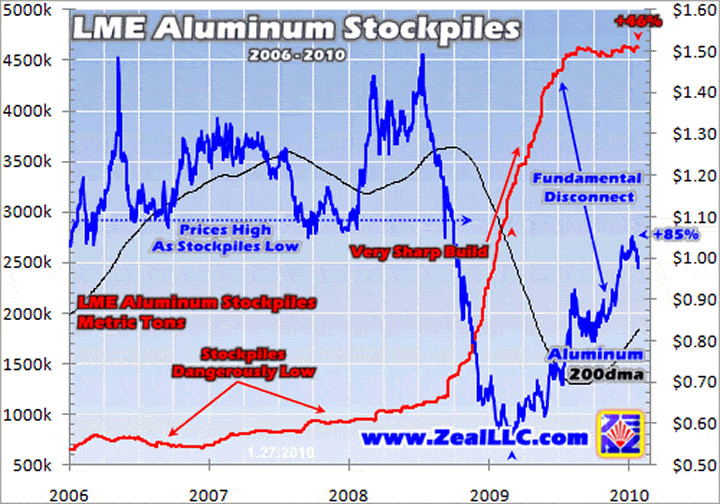
At the beginning of aluminum’s bull its LME stockpiles got down to only about 3 to 4 days worth of global usage, which boosted its prices above the $1 level. But when these stockpiles started to mount a material build in the second half of 2008, aluminum’s price was doomed. Aluminum consumption fell so fast into and after the panic that the producers couldn’t throttle back supply fast enough.
This stockpile build had been incredibly sharp, hardly taking a breather until the second half of 2009. LME warehouses are now teeming with aluminum, at record levels. And how did prices respond? With a rally that has completely ignored fundamentals. Since aluminum bottomed in February 2009, it had a well-deserved initial recovery off its oversold lows. But it kept on going, rising 85%. Over this same exact span LME aluminum stockpiles rose 46%, again a major disconnect.
So how are we supposed to read these fundamental disconnects? There is no doubt that LME stockpile levels are exceptionally high. These very material rises indicate that there is an oversupply, however temporary it may be, and that consumers should not have a problem going to the market to buy base metals. Are we to just assume that these base metals are wildly overbought and all due for sharp corrections once the interim fundamental picture becomes clear to traders? Perhaps, but perhaps not.
One valid argument for a delay in corrections is that fundamentals are still out the door thanks to the stock panic. With everything so oversold as a result of the first stock panic in over 100 years, everything seems to be recovering in lockstep with the world’s premier stock index. My business partner Adam Hamilton wrote an essay earlier this month that included a copper price chart overlaying the S&P 500. It is quite stunning to see the correlation, I encourage you to check it out!
We must also consider that these prices may be factoring in future supply deficits and thus lower stockpile levels. The global credit crisis has seriously hampered the infrastructure buildout of the mining industry. Miners are responsible for the lion’s share of supply, and they need to continually renew reserves and build new mines to grow production and replace depleted deposits. But the lack of credit has shut down a lot of development projects and throttled back exploration efforts. This will likely lead to future supply constraints.
Yet another factor to consider is that base metals are still priced in US dollars. Today’s nominal prices aren’t actually as high as they seem if the true value of today’s dollar is taken into account. With the money supply continuing to grow at a staggering pace, adjusting for inflation would show a much lower real value for these metals. And if I was running a country that was stuck with a lot of US dollars, I’d certainly diversify some of them into say copper or aluminum rather than keep everything in a currency that is in the midst of a secular bear. Perhaps foreign investment, diversification, and dollar hedging will play a bigger role on the consumption front from here.
Even with these possible disconnect explanations, based on what we are seeing with LME stockpile levels it is painfully obvious that base metals prices have disconnected from fundamentals. While a new balance may be developing, I still believe there is a higher probability for a correction than not. Current copper, zinc, nickel, lead, and aluminum prices are still 367%, 211%, 154%, 406%, and 75% above their respective 2003 lows. Even a decent-sized correction from these levels will not challenge the integrity of their secular bulls.
But whether a correction, consolidation, or ongoing upward momentum, base metals prices will in all likelihood continue to move higher over the long term. And the best way for investors to leverage these gains is by owning the mining companies that bring these metals to market. There are a number of quality miners that are making money hand-over-fist at today’s prices, can still do so at lower prices, and are well-positioned for future growth. There is also an elite group of junior explorers that are finding and developing the deposits that represent the next generation of base metals mines.
If you are interested in base metals stocks but don’t want to go through the hassles of painstaking fundamental research, at Zeal we can make the job easier for you. We do all the research, sifting through hundreds of stocks, and publish reports that profile the best-of-the-best in a given sector. And our two most-recent reports happen to focus on base metals. Arm yourself with the knowledge of which stocks to buy, by purchasing a Zeal Report today!
Though base metals corrections may have near-term adverse effects on the mining stocks, investors should embrace such scenarios as buying opportunities. In our acclaimed weekly and monthly newsletters we’ll be gearing up for buying once the timing is right. Join us today, as opportunities abound for those who stay on top of these exciting markets.
The bottom line is the relationship between LME stockpile data and prices offers traders a unique insight into the explosive base metals markets. LME stockpile fluctuations occur on a near-real-time basis, which gives us measurable and meaningful intelligence on the flux of this sector. And ultimately the LME’s intent on creating price convergence has played out rather well.
But since the panic a fundamental disconnect has disrupted the balance of the base metals markets. Prices are rising even though stockpiles are building at a torrid pace. Normally stockpile builds put selling pressure on the base metals, but this hasn’t been the case of recent. Is there a new balance being created in this post-panic economy, or is there an imminent correction right around the corner? Either way investors need to be ready to buy the miners when opportunities arise. This secular bull has yet to run its course.
By Scott Wright
So how can you profit from this information? We publish an acclaimed monthly newsletter, Zeal Intelligence , that details exactly what we are doing in terms of actual stock and options trading based on all the lessons we have learned in our market research as well as provides in-depth market analysis and commentary. Please consider joining us each month at … www.zealllc.com/subscribe.htm
Thoughts, comments, or flames? Fire away at scottq@zealllc.com . Depending on the volume of feedback I may not have time to respond personally, but I will read all messages. Thanks!
Copyright 2000 - 2010 Zeal Research ( www.ZealLLC.com )
Zeal_LLC Archive |
© 2005-2022 http://www.MarketOracle.co.uk - The Market Oracle is a FREE Daily Financial Markets Analysis & Forecasting online publication.


