Dow Jones Industrials Skating on Thin Ice
Stock-Markets / US Stock Markets Jul 31, 2007 - 08:27 PM GMTBy: Gary_Dorsch
Perhaps the most important market in the world today is the vast network of foreign currencies, where total trading volume, including derivatives and futures, average around $2.9 trillion a day. This is ten times the size of the combined daily turnover on all the world's equity markets. And as world's economies have become increasingly integrated, so have the foreign exchange and global capital markets.
But the foreign exchange market is only one piece, albeit a very important one, of a bigger puzzle. Turnover of interest rate, currency and stock index derivative contracts rose 24% to a mind boggling $533 trillion in the first quarter versus the previous quarter, underscoring the enormous leverage in the global markets. Thus, any major unexpected event in the currency markets can touch off a panic and violent market reactions in the global bond and stock markets, or gold.

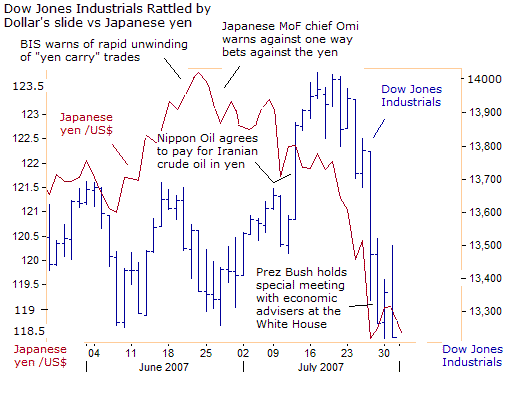
In the “brave new world” of global investing, sentiment can often turn on a dime, and at a moment's notice. For instance, the Dow Jones Industrials (DJI-30) lost 4.2% last week to key horizontal support at 13,250, its worst performance in five years. In the background, the US dollar was sliding from 122-yen to as low as 118-yen, triggering the unwinding of the “yen carry” trades that wiped out $2.1 trillion of global stock market value. (The July 27th and July 31st editions of the Global Money Trends newsletter www.sirchartsalot.com provided in-depth analysis of the “yen carry” trade and forecasts for its far ranging impact on global markets).
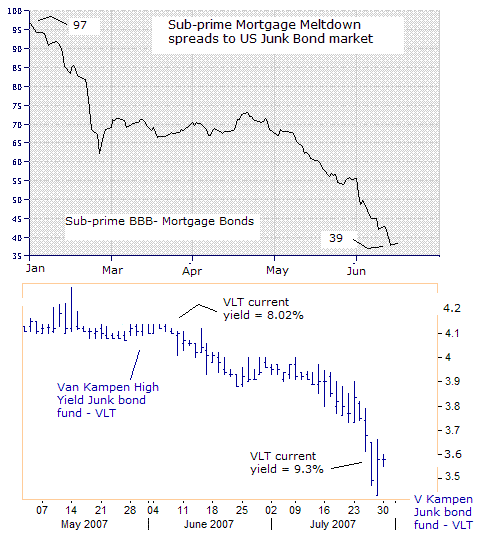
But a new headache has emerged beyond the US dollar's woes. Many high yield “Junk” bond funds lost 10% to 15% of their value over the past six weeks, amid concerns that defaults in securities backed by sub-prime mortgages may spread across the credit markets. Interest rates for leveraged buy-out artists, who issue junk bonds to finance acquisitions soared 120 basis points, and more than forty junk bond offerings were canceled or restructured worldwide in the past five weeks.

The second wave down for risky sub-prime BBB- mortgage securities, from the 70-level towards the 40-area, since May 1st, has spread to the US junk bond sector, knocking Van Kampen's High Yield Bond fund (symbol VLT) about 10% lower to the $3.60 /share area. Sharply higher junk bond yields could slow down leveraged buy-outs by private equity firms, removing a key prop for the US stock market, and drying up liquidity in a market priced for perfection.
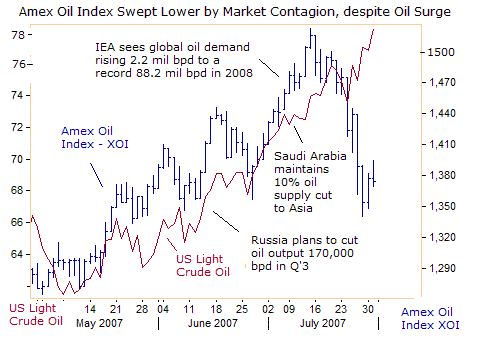
Also spooking the DJI-30 is the escalating cost of crude oil, which topped $78 per barrel today, it's highest in 12-months, just shy of the record high of $78.40 per barrel. Higher oil prices fuel inflation, crimps disposable income of consumers, and dents corporate profits. On July 16th, Goldman Sachs predicted crude price could top $90 a barrel this autumn and hit $95 by the end of the year, if OPEC keeps oil production capped at current levels, of 26.6 million barrels per day.
In its Monthly Oil Market Report, the International Energy Agency said global demand for crude oil will rise by an average 2.2 million barrels a day in 2008, up from this year's expansion of 1.53 million bpd. Oil demand next year will average 88.2 million bpd, the IEA said. The increase in global demand could outstrip the increase in new supplies, so OPEC finds itself firmly in the driver's seat.
Oil and gas export revenue for OPEC's 12 members hit a record $649 billion in 2006, up 22% from the previous year, the cartel said in its Annual Statistical Bulletin. The biggest windfall went to Saudi Arabia with $193 billion, the UAE $70 billion, Iran $59 billion, Kuwait $54 billion, and Hugo Chavez's Venezuela's $48.4 billion .

Interestingly enough, the energy sector has been swept lower by selling contagion from the broad market's weakness. The energy sector was a top performer in the S&P 500 index last quarter, so when a leader of the bull market tumbles 10% from its record highs, it begins to rattle the broad market. Still, if one must be invested in the stock market, the Amex Oil Index could be a relative “safe haven,” with crude oil prices aiming for the $80 per barrel mark.
With the Dow Jones Industrials tumbling 146-points to close below key support to the 13,200 level, US Treasury chief, Henry Paulson is desperately trying to head-off a trade war between the US Congress and China. Paulson is in Beijing this week, and it might be a bit difficult for the chairman of the President's Working Group on Financial Markets, otherwise known as the “Plunge Protection Team” (PPT), to monitor market conditions from long distance.
The US Congress is passing “veto proof” legislation aimed at punishing China for its currency policy. “At a time when US exports are growing globally, such legislation also exposes the United States to the risk of mirror legislation abroad and could trigger a global cycle of protectionist legislation,” Paulson warned.
 However, US legislators argue the undervalued yuan is fuelling the trade deficit with China, which hit $232.5 billion dollars last year. Since January, the US trade gap with China has risen to $96.3 billion, compared with $82.2 billion in the same period a year ago, a 17.2% increase. To mollify Wall Street, Beijing said it would allow approved international investors to purchase up to $30 billion of stocks usually reserved for domestic buyers, compared with the $10 billion quota before.
But Sen. Charles Grassley, an Iowa Republican, who crafted a bipartisan bill that passed the Senate Finance Committee by a margin of 20 to 1, is fed-up with the Bush administration's secret dealings with Beijing, and mounting trade deficits, that have been blamed for the loss of more than 3 million US manufacturing jobs since 2000. Jittery Republicans are crossing the isle to join up with Democrats on a “veto-proof” China and Japan trade bill, ahead of the Nov 2008 elections.
“China's progress on currency modernization has been glacial. It's good to continue the dialogue, but we can't rely on it exclusively. Also, the Finance Committee bill isn't a China bill. It's not directed at any single country. It's a much-needed overhaul of our current law, which dates to 1988. And it's been drafted to comply with our WTO obligations. I look forward to seeing currency exchange rate legislation passed this Congress,” Grassley added.
The story gets more interesting by the day. The Global Money Trends newsletter is your best investment, to track global commodity, currency, and bond and stock markets, with commentary and analysis that is not found in the mainstream media. Of course, each edition contains a lot of cool charts, and is published on Friday's, with special alerts when unexpected events unfold.
By Gary Dorsch,
Editor, Global Money Trends newsletter
http://www.sirchartsalot.com
This article is just the Tip of the Iceberg, of what’s available in the Global Money Trends newsletter! Here's what you will receive with a subscription, Insightful analysis and predictions for the (1) top dozen stock markets around the world, Exchange Traded Funds, and US home-builder indexes (2) Commodities such as crude oil, copper, gold, silver, the DJ Commodity Index, and gold mining and oil company indexes (3) Foreign currencies such as, the Australian dollar, British pound, Euro, Japanese yen, and Canadian dollar (4) Libor interest rates, global bond markets and central bank monetary policies, (5) Central banker "Jawboning" and Intervention techniques that move markets.
GMT filters important news and information into (1) bullet-point, easy to understand analysis, (2) featuring "Inter-Market Technical Analysis" that visually displays the dynamic inter-relationships between foreign currencies, commodities, interest rates and the stock markets from a dozen key countries around the world. Also included are (3) charts of key economic statistics of foreign countries that move markets.
A subscription to Global Money Trends is offered at only $150 US dollars per year for “44 weekly issues”, including access to all back issues. Click on the following hyperlink, to order now, http://www.sirchartsalot.com/newsletters.php Call toll free from USA to order, Sunday thru Thursday, 2 am to 4 pm EST, at 866-576-7872.
Mr Dorsch worked on the trading floor of the Chicago Mercantile Exchange for nine years as the chief Financial Futures Analyst for three clearing firms, Oppenheimer Rouse Futures Inc, GH Miller and Company, and a commodity fund at the LNS Financial Group.
As a transactional broker for Charles Schwab's Global Investment Services department, Mr Dorsch handled thousands of customer trades in 45 stock exchanges around the world, including Australia, Canada, Japan, Hong Kong, the Euro zone, London, Toronto, South Africa, Mexico, and New Zealand, and Canadian oil trusts, ADR's and Exchange Traded Funds.
He wrote a weekly newsletter from 2000 thru September 2005 called, "Foreign Currency Trends" for Charles Schwab's Global Investment department, featuring inter-market technical analysis, to understand the dynamic inter-relationships between the foreign exchange, global bond and stock markets, and key industrial commodities.
Copyright © 2005-2007 SirChartsAlot, Inc. All rights reserved.
Disclaimer: SirChartsAlot.com's analysis and insights are based upon data gathered by it from various sources believed to be reliable, complete and accurate. However, no guarantee is made by SirChartsAlot.com as to the reliability, completeness and accuracy of the data so analyzed. SirChartsAlot.com is in the business of gathering information, analyzing it and disseminating the analysis for informational and educational purposes only. SirChartsAlot.com attempts to analyze trends, not make recommendations. All statements and expressions are the opinion of SirChartsAlot.com and are not meant to be investment advice or solicitation or recommendation to establish market positions. Our opinions are subject to change without notice. SirChartsAlot.com strongly advises readers to conduct thorough research relevant to decisions and verify facts from various independent sources.
© 2005-2022 http://www.MarketOracle.co.uk - The Market Oracle is a FREE Daily Financial Markets Analysis & Forecasting online publication.


