Honest Money Financial Markets Wrap, Gold, Silver Stocks and Commodities
Stock-Markets / Financial Markets 2010 Feb 09, 2010 - 09:25 AM GMT The following excerpt is from the latest full-length market wrap report, available only at the Honest Money Gold & Silver Report website. All major markets are covered: stocks, bonds, currencies, and commodities, with the emphasis on the precious metals. There is a lot of information on gold and silver, not only from an investment point of view, but also from its position as being the mandated monetary system of our Constitution - Silver and Gold Coin, as in Honest Weights and Measures.
Stocks
After all the huffing and puffing was over, the S&P closed down 0.72%. Earlier in the week, the Dow was up a couple of hundred points, but it gave it back on Thursday.
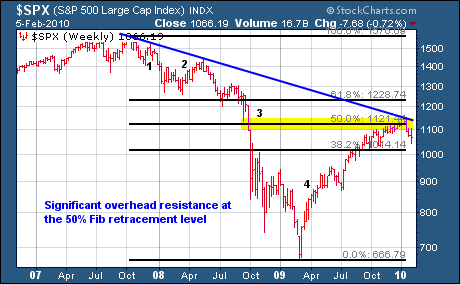
Needless, to say, volatility reigns supreme. It appears that a fifth wave down is starting, as evidenced by the first chart below. The 50% Fibonacci retracement level provided stiff resistance and stopped the market dead in its tracks. At the least, an intermediate term correction is underway, although an oversold rally is likely.
It has been my position from the start ofthe rally last March that the rebound is a counter-trend rally in a secular bear market that is still the dominant force to be reckoned with. This is, however, just my subjective opinion, and it cannot be proven to be true or not. Only time will tell. Hindsight still trumps foresight - unfortunately.
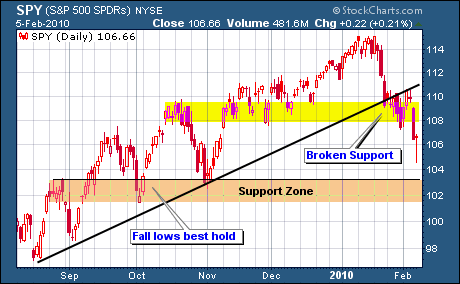
The next chart shows the S&P 500 (SPY's) breaking below lower diagonal support and the Dec. lows. This suggests that the November lows will be tested in the not too distant future. Friday's candlestick, however, shows downside momentum is waning, and that an oversold snap-back rally is probable.
Bonds
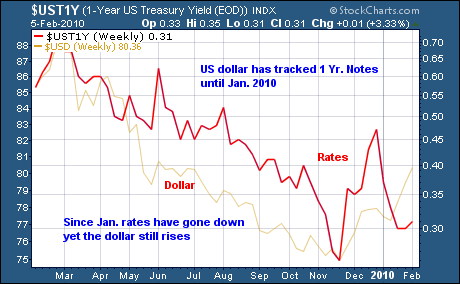
Interest rates have a strong influence on the market. The chart below shows that the dollar has tracked 1 Year Treasury rates for most of the year. In Jan. rates started to fall, yet the dollar rallied, and has continued to do so. Now, short term rates are turning back up, which supports the dollar even more.
It has been the rising dollar that hurt commodities and the stock market. Since the markets began to rally last March, the dollar was the impetus behind it. A falling dollar meant rising asset prices.
Now, a rising dollar means falling asset prices. The question is: will this relationship continue? If not, what will replace it? This discussion is left for our paid subscribers.
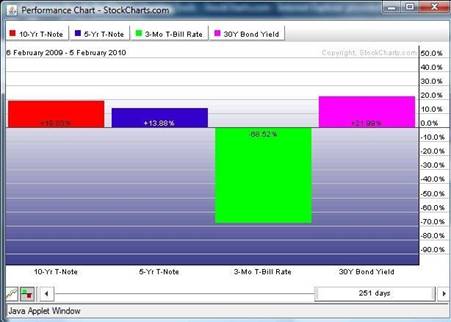
But the dollar only tells part of the story. Short terms rates have been falling overall, while at the same time, long term rates have been rising; hence the spread or yield curve has been steepening.
The next chart shows short term rates falling precipitously, while long term rates rise progressively up the yield curve. When all is said and done, the Fed will protect the U.S. Treasury bond market, as that is where the money comes from - that and taxes.
But the Fed may not be able to protect the bond market. The huge supply of debt needed to fund the various bailout schemes is already causing investors around the world to demand more interest for the increased risks.
In the final analysis it is the market that ultimately sets rates - not the Fed. The Fed directs short term rates. Long term rates are set by the market; and the bond vigilantes are getting restless.
Currency
The dollar continued to rally this week, tacking on another 0.85%. As the next chart shows, however, overhead resistance is fast approaching. The dollar is overbought, and the 38% Fib retracement level may stem the tide for a bit of a respite.
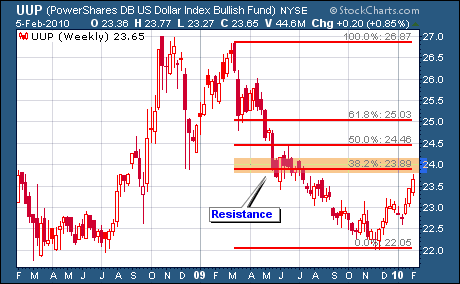
The above chart suggests that the dollar may shortly consolidate or correct, but it's possible that it does not. A lot of risk aversion is gripping the market due to the sovereign debt issue(s); and there has been a subsequent flight to liquidity (the dollar).
A good deal of short covering has occurred, as carry trades unwind; however, with markets so out of balance, another round of unwinding could come at any time; buyers beware. In today's markets - liquidity is the watchword.
The U.S. dollar market is the largest, most liquid market in the world. When panic hits, this trumps all other concerns. Big money needs a big birth to park itself in.
Gold
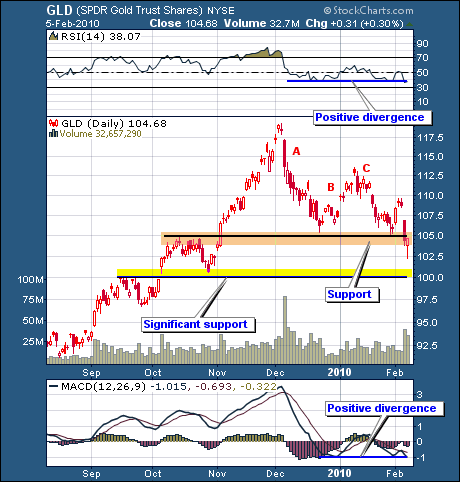
Gold lost $15.90 to close at $1065.60, for a weekly loss of -1.47% (continuous contract). The daily GLD chart shows an A-B-C correction underway. Price is presently testing horizontal support that goes back to Oct. - Nov. If support doesn't hold, the next line of defense is the yellow horizontal support band at 100, which goes back to Sept.
Downside momentum is waning and RSI and the histograms are showing slight positive divergences. Friday's candlestick was a hammer, which suggests that downside momentum is turning and that a short term reversal may be at hand. The open gap above looks inviting.
As opposed to the dollar, gold is one of the smallest markets in the world; however, gold is still a liquid market. It can be bought and sold at any time. The fact that it is a small market means that it can be easily moved by hot money flows. Sometime in the not too distant future, this will be very advantageous for gold's price.
There were several other charts in this week's report that contained bullish engulfing candlesticks and or reversal formations; albeit for the short term.
If an oversold bounce does occur, even for a couple of days, the following charts look poised and ready to profit thereby. Remember - the operative word is if.
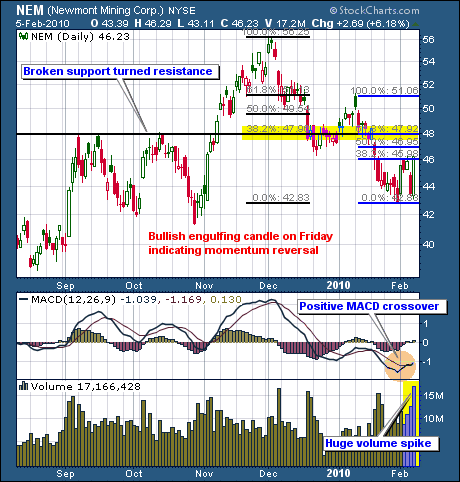
Newmont Mining looks good for a few reasons, however, if the overall stock market doesn't rally, Newmont will most likely stall as well. Notice on the chart that NEM has held above the Oct. & Nov. lows. It has made a higher low. Very few of the gold stocks are in this position. Most have broken well below their autumn lows.
RSI shows a positive crossover. Once again, few, if any gold stocks have positive crossovers; although there are several that have positive set-ups. Lastly, look at the huge volume spike on Friday's bullish engulfing candlestick. That was some serious buying taking place and it will need to be digested.
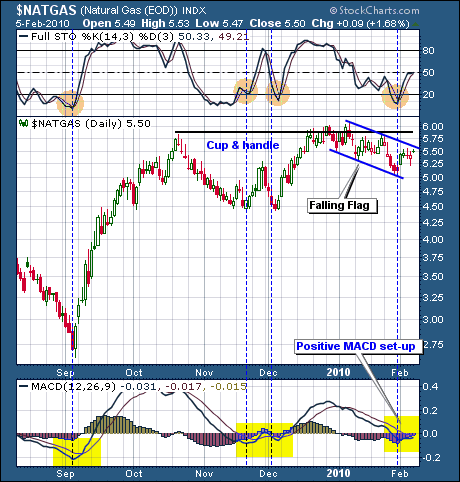
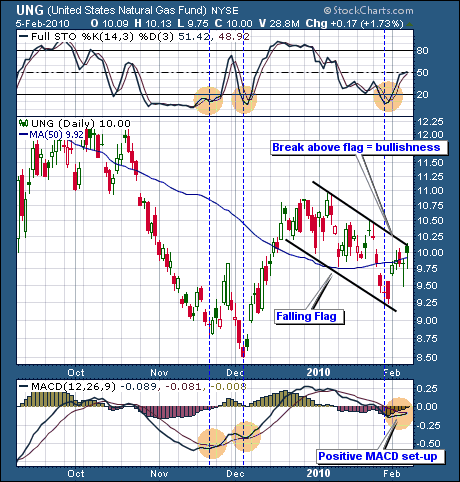
Natural Gas is one of the few commodities that have not been decimated, at least not recently. It is holding up quite well. The chart shows a cup & handle formation, along with a falling flag. Both are bullish set-ups that now need confirmation or follow through.
Natural gas is hard to play without using futures and the associated risks therein. There are two "funds" that are supposed to track NG: UNG & GAZ, however, they don't always move in the same direction or magnitude of the underlying commodity (NG). They are tricky to play.
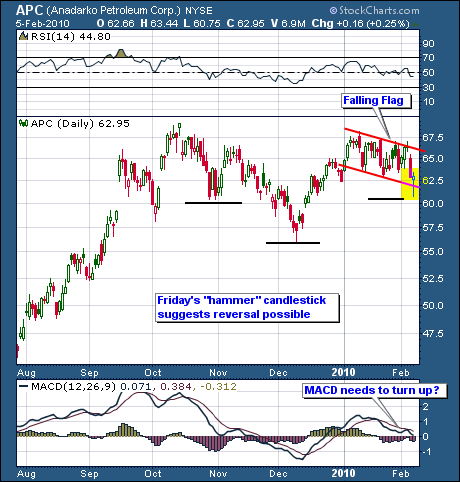
The other way to play NG is to invest in companies that produce it. Up first is a chart of UNG and following that is a chart of APC - the second largest US producer of natural gas.
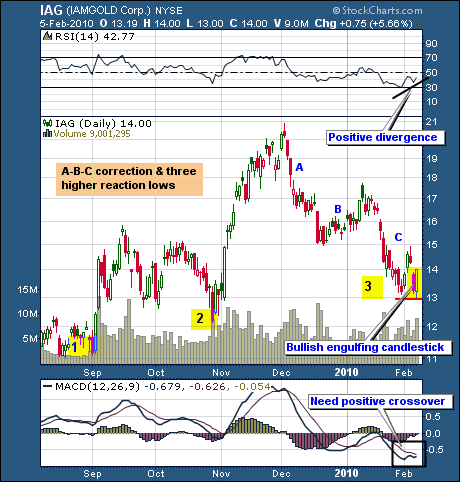
The last stock we are going to mention from this week's stock watch list is I Am Gold (IAG). It has been in and out of the watch list many times over the course of the bull market.
On the chart below notice the series of higher reaction lows. The most recent Feb. low did NOT break below the Oct. - Nov. lows. Aside from Newmont, mentioned earlier, there are few gold stocks that have NOT broken below their autumn lows. This shows relative strength versus the overall sector.
Friday's engulfing candlestick coupled with the surge in volume looks promising; however, it needs to be confirmed. If the overall stock market continues to correct, it will put a head wind to even the strongest gold stocks.
IAG has constructed an A-B-C correction that may have put in a double bottom. We should know this week. Notice that RSI has made a positive divergence: it made a higher low, while price made a lower low.
Confirmation with a positive MACD crossover is needed. As of now I look at this as a trading possibility - if it confirms. If it does, then we re-evaluate the landscape to see if it has legs or not - taking one step at a time.
Conclusion
In today's turbulent times, gold and silver are more important than ever. Some analysts believe that the precious metal and commodity bull market is over. Can one be over without the other? Might neither be over? What other possibilities are there? Have gold & the dollar ever gone up together - and when? What is the best asset to invest in right now?
If you would like to read a comprehensive report that covers all these issues and more, including up to 40 easy to read charts per weekly issue, we invite you to try a three month trial subscription for only $69.00.
Our stock watch list provides numerous investment ideas each week, and our model portfolio offers you a game plan to implement them. Weekly email alerts keep you posted of market moving events.
Notice the performance of the stocks discussed above, and see if they suit your investment goals - profits. If they do, stop by and check out our website. There is no obligation to continue your subscription and the free book and other reports are yours to keep regardless.
Good luck. Good trading. Good health, and that’s a wrap.

Come visit our website: Honest Money Gold & Silver Report
New Audio-Book Now Available - Honest Money
Douglas V. Gnazzo
Honest Money Gold & Silver Report
About the author: Douglas V. Gnazzo writes for numerous websites and his work appears both here and abroad. Mr. Gnazzo is a listed scholar for the Foundation for the Advancement of Monetary Education (FAME).
Disclaimer: The contents of this article represent the opinions of Douglas V. Gnazzo. Nothing contained herein is intended as investment advice or recommendations for specific investment decisions, and you should not rely on it as such. Douglas V. Gnazzo is not a registered investment advisor. Information and analysis above are derived from sources and using methods believed to be reliable, but Douglas. V. Gnazzo cannot accept responsibility for any trading losses you may incur as a result of your reliance on this analysis and will not be held liable for the consequence of reliance upon any opinion or statement contained herein or any omission. Individuals should consult with their broker and personal financial advisors before engaging in any trading activities. Do your own due diligence regarding personal investment decisions. This article may contain information that is confidential and/or protected by law. The purpose of this article is intended to be used as an educational discussion of the issues involved. Douglas V. Gnazzo is not a lawyer or a legal scholar. Information and analysis derived from the quoted sources are believed to be reliable and are offered in good faith. Only a highly trained and certified and registered legal professional should be regarded as an authority on the issues involved; and all those seeking such an authoritative opinion should do their own due diligence and seek out the advice of a legal professional. Lastly Douglas V. Gnazzo believes that The United States of America is the greatest country on Earth, but that it can yet become greater. This article is written to help facilitate that greater becoming. God Bless America.
Douglas V. Gnazzo © 2009 All Rights Reserved
© 2005-2022 http://www.MarketOracle.co.uk - The Market Oracle is a FREE Daily Financial Markets Analysis & Forecasting online publication.


