


Stock Market Investors, Here's Why You Need to Pay Careful Attention
Stock-Markets / Stock Index Trading Feb 12, 2010 - 08:53 AM GMTBy: Marty_Chenard

This past Tuesday, our update was entitled "Is there such a thing as a "lead dog" index?"
We won't repeat that discussion and overview, because you can still read it at this link: Lead Dog.
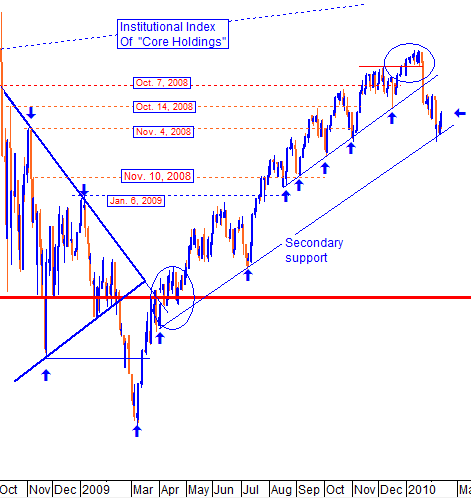
Tuesday's chart showed a 4 month trending pattern view of the Institutional Index. Today, we will expand that time period and discuss a 16 month chart and the LONG term pattern it is showing.
Some investors are thinking that we have now entered a new Bear Market condition.
The Institutional Index is not saying that. It is saying that we are very CLOSE to such a condition, but not there yet.
Today's chart tell's you why ...
What is noticeable first, is that the daily chart of the Institutional Index of "Core Holdings" fell below its primary support line on January 22nd.
It then tested and held its secondary support line on February 5th. That secondary support line defined the new Bull market that started in early 2009.
So now, the Index is still above the second support ... but also in a short term technical down trend because it has made lower/highs and lower/lows.
Bottom Line: We are at an important testing and pivot point for the market ... the second most important point since last April.
Here is where investors need to pay close attention to what happens to the Institutional Index of "core holdings" held by Institutional Investors. (Institutional Investors are responsible for over 50% of the volume on any given day.)
** Feel free to share this page with others by using the "Send this Page to a Friend" link below.
By Marty Chenard
http://www.stocktiming.com/
Please Note: We do not issue Buy or Sell timing recommendations on these Free daily update pages . I hope you understand, that in fairness, our Buy/Sell recommendations and advanced market Models are only available to our paid subscribers on a password required basis. Membership information
Marty Chenard is the Author and Teacher of two Seminar Courses on "Advanced Technical Analysis Investing", Mr. Chenard has been investing for over 30 years. In 2001 when the NASDAQ dropped 24.5%, his personal investment performance for the year was a gain of 57.428%. He is an Advanced Stock Market Technical Analyst that has developed his own proprietary analytical tools. As a result, he was out of the market two weeks before the 1987 Crash in the most recent Bear Market he faxed his Members in March 2000 telling them all to SELL. He is an advanced technical analyst and not an investment advisor, nor a securities broker.
Marty Chenard Archive |
© 2005-2022 http://www.MarketOracle.co.uk - The Market Oracle is a FREE Daily Financial Markets Analysis & Forecasting online publication.