U.S. Real Estate Market and Interest Rates in 2010 and Beyond
Interest-Rates / US Housing Feb 12, 2010 - 12:19 PM GMTBy: Mike_Larson
 Last week’s World MoneyShow in Orlando was a huge success! I had the pleasure of meeting several of you at the Gaylord Palms Hotel, and I couldn’t have been happier with the constructive feedback you shared.
But I also know that not everyone could make the trek. And I don’t want to leave you out in the cold!
So today, I’d like to share the major points of my Orlando presentation. Entitled “Real Estate and Interest Rates in 2010 — and Beyond,” it laid out a roadmap for these two critical markets. I also wrapped things up with critical “action steps” to take now … before it’s too late.
Let’s Tackle Housing First …
I have no qualms about slamming any sector of the market if I believe that’s the right thing to do. I predicted the real estate crash before it unfolded, and listed 25 real estate stocks to “avoid like the plague” in April 2005. New Century Financial subsequently went broke. Washington Mutual failed. Twenty-four of the 25 stocks on the list fell, with an average drop of 78.5 percent.
But a combination of factors has made me much less bearish on housing. They suggest we’re seeing the market start to bottom out, with the ultimate low in home prices likely in 12-18 months.
For starters, as shown in the chart below, an index that tracks housing affordability recently hit an all-time high. Prices have fallen so much that housing is fundamentally “cheap” again in many markets.

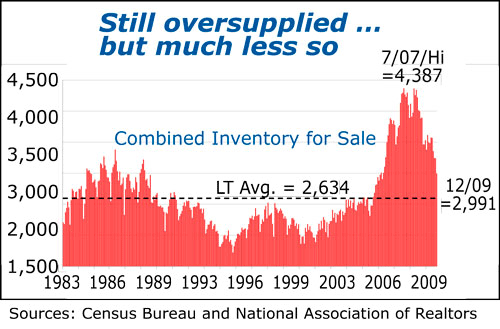
The following chart reveals that the oversupply problem in housing is also rapidly being corrected. Combined new and existing home inventories are now only about 360,000 units above the long-term average. Total supply has dropped almost 1.4 million from the December 2007 peak.

Lastly, the “infinite intervention” by the government and the Federal Reserve is holding down mortgage rates.
This does NOT imply that we’ll have a vigorous, “V-shaped” rebound. Far from it. The large amount of “shadow inventory” hiding on the balance sheets of banks and companies like Fannie Mae and Freddie Mac will be parceled out over time into the market. Lending standards will remain relatively tight. And foreclosures will still beguile us. But a slow, anemic recovery still seems likely.
Recognize That Housing Is No Longer the “Big Story”
I don’t just track the real estate markets closely. I also follow bonds and interest rates. And my MoneyShow presentation made it very clear that housing is no longer the “big story” for the financial markets and the global economy. Interest rates are.
As I explained, four forces are combining in the here and now to drive the cost of financing higher …
Force #1: Exploding Deficits!
The 2009 budget deficit of $1.4 trillion was the worst in history, and equal to 9.9 percent of Gross Domestic Product. The Congressional Budget Office (CBO) is expecting another $7.4 trillion in deficits over the coming decade, while the Obama administration is projecting $8.5 trillion. Additional war costs, economic stimulus programs, and health care reform could drive those numbers even higher.
Force #2: Fed Fueling Inflation Fears!
The Fed has committed to peg the federal funds rate at a range of zero percent to 0.25 percent for an “extended period.” It still hasn’t finished buying $1.25 trillion of mortgage backed securities. And its balance sheet has exploded to $2.2 trillion from $879 billion in just two years.
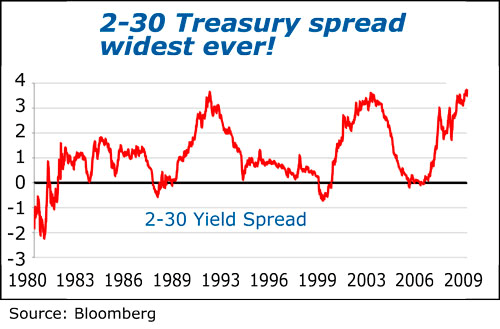
These actions have conspired to drive the spread between yields on 2-year Treasury notes and 30-year Treasury bonds to record levels. They have also caused TIPS spreads … an indicator of market inflation fears … to blow out to an 18-month high.

Force #3: Massive Supply Tsunami!
Marketable Treasury debt surged 24 percent to a record $7.2 trillion in 2009. Net issuance of government debt already hit a stunning $922 billion in 2008. It then surged even higher to $2.1 trillion in 2009, and it’s on track to top $2.5 trillion this year. The size of weekly debt auctions has ballooned to almost $120 billion.
Force #4: Falling Dollar and Foreign Selling!
The dollar index dropped 17 percent between March and November 2009, while bond futures fell about 18 percent from December 2008 through November 2009. That “double whammy” slammed the value of bonds held by our foreign creditors.
The short-term rally in the dollar since then doesn’t change the long-term trend. And with foreigners owning roughly 60 percent of our marketable debt, the risk they’ll flee government bonds is rising rapidly.
My prognosis: Bond prices will tank and interest rates will rise sharply. The 10-year Treasury note yield sank to 2.06 percent in December 2008. It was recently around 3.6 percent. I expect to see 5.5 percent-6 percent by the time this move is over. That would be roughly a TRIPLING of rates off the low.
Meanwhile, long bond futures prices could fall from the high of 143 to as low as 100. I added that the huge rally in corporate and junk bond prices made them vulnerable — and urged investors to lighten up on their holdings there.
My Final Warning: Do NOT Ignore What Is Happening Overseas — Or What It Ultimately Means for U.S. Bonds!
Lastly, I hammered home a key point about the crisis in the European debt markets. Many pundits believe it’s “their” problem that Greece, Portugal, Ireland, and Spain are the focus of this crisis. That it doesn’t “mean” anything for the U.S. bond market.
I said those pundits couldn’t be more wrong …
What we’re seeing in those smaller, peripheral debt markets is just a preview of what will eventually happen here. The reason? The underlying causes of the government crises in Europe — surging debts, exploding deficits, etc. — are the very same problems we’re dealing with in the U.S. Only the numbers here are much, much worse.
Bottom line: It’s only a matter of time before the sovereign debt crisis hits home. So you may want to take steps to protect yourself — and profit — from what’s to come. Specifically, consider dumping long-term U.S. government debt and buying inverse ETFs that rise in value when bond prices fall and interest rates rise.
Again, thanks to all of you who joined me in Orlando. I’m looking forward to the next opportunity to chat. And if you weren’t able to come, I hope you found this recap of my presentation helpful.
Until next time,
Mike
P.S. As a few of you noted, and as I’m well aware, the Blitz did not begin in the “mid-1940s.” It was mid-1940. An editing error was responsible for the mistake in last week’s Money and Markets. Our apologies for the mix up.
P.P.S. Weiss Research has teamed up with the Red Cross to help bring in donations for the earthquake victims in Haiti. If you’d like to make a contribution, just click here now
This investment news is brought to you by Money and Markets. Money and Markets is a free daily investment newsletter from Martin D. Weiss and Weiss Research analysts offering the latest investing news and financial insights for the stock market, including tips and advice on investing in gold, energy and oil. Dr. Weiss is a leader in the fields of investing, interest rates, financial safety and economic forecasting. To view archives or subscribe, visit http://www.moneyandmarkets.com.
© 2005-2022 http://www.MarketOracle.co.uk - The Market Oracle is a FREE Daily Financial Markets Analysis & Forecasting online publication.


