


Stock Market S&P500 Index Half Way Towards A Bottom Low
Stock-Markets / Stock Markets 2010 Feb 14, 2010 - 06:20 AM GMT

 On January 10th, we wrote: “The S&P500 has now touched the current upper trend line as formed since early last year. On January 15th 2010 we are also 45 weeks or 225 trading days after the March 2009 bottom. In Gann terms this point in time is typically a hard angle that typically come in as a high.
We expect the market to continue its trend towards this important mid-point in time. Next to this, we are also approaching a dominant natural cycle that is forming its crest. On the short-term we expect the dominant cycle to approach its crest early to mid January 2010 on the S&P500. The cycle crest can form as early as January 8th or as late as the end of January +- 4 trading days, with January 15th as the expected mid-point of the cycle”.
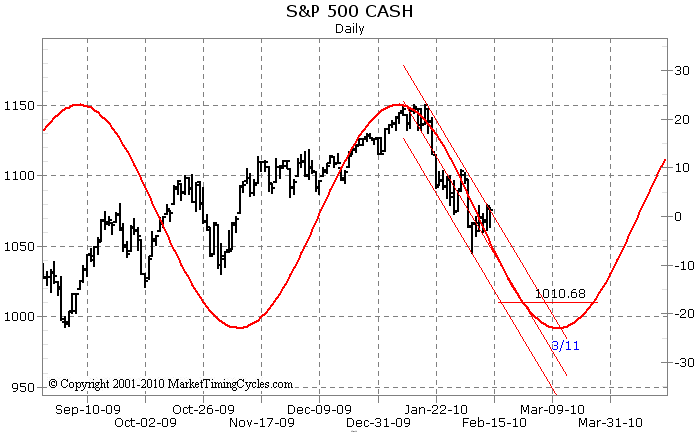
The expected midpoint of January 15th for a medium term top to occur in the S&P500 was only +- 4 days from the real top. The actual top in the S&P500 was set on January 19th on the close, which was only slightly higher than the close price on January 14th. We are now on our way to a medium term bottom low using the dominant MTC4 cycle downwards as our guide.
The medium term outlook
Using our MTC4 dominant cycle we now expect the bottom low to occur for the S&P500 around March 11th 2010 +- 7 days. The price target will be around 1010.68 on the S&P500 +- 20 points
The longer term view
For the longer term we stay on the bullish side , unless we close below the low of early July 2009.

The question remains whether the end of a wave 2 of a larger degree was completed at January 19th 2010. It could. However I expect a longer-term Delta cycle still to be formed before mid 2010. Although the average time of this delta high to complete ranges from January up to July 2010.
From an Elliott wave perspective you can see a Elliott Wave 2 of this degree has a very wide span of completion in time. As we also haven’t tested the Old Heads and Shoulders support and resistance lines yet, I expect this line needs to be crossed/touched first before we continue on the longer-term bear market down-trend.
So, in our opinion we are now on a counter trend downwards towards early March , after which the trend will continue possible on its last wave to complete Wave 2 of some degree.
Conclusion
We are now half way the dominant MTC4 cycle downwards. We expect a cycle trough to occur for the S&P500 around March 11th 2010 +- 7 days. The price target will be around 1010.68 on the S&P500 +- 20 points. For the longer term we remain on the bullish side , unless we close below the low of early July 2009.
Join a group of select individuals and subscribe to our newsletter here and we will put you on our mailing-list. We respect your privacy. We don’t sell, rent or share your name or email address.
© 2001-2009 MarketTimingCycles.com. www.markettimingcycles.wordpress.com
This article is not part of a paid subscription service. It is a free service and is aimed to educate and demonstrate the successful application of cycle analysis. At no time will specific security recommendations or advice be given. Whilst the information herein is expressed in good faith, it is not guaranteed. A trading system that never makes mistakes does not exist. Error and uncertainty are part of any effort to assess future probabilities. Trade at your own risk. Read our full disclaimer.
© 2005-2022 http://www.MarketOracle.co.uk - The Market Oracle is a FREE Daily Financial Markets Analysis & Forecasting online publication.