Gold Falling Bullish Wedge
Commodities / Gold and Silver 2010 Feb 14, 2010 - 02:18 PM GMTBy: Clive_Maund
 The past week has seen the convergence of a variety of factors that together point to a powerful rally in gold soon. Thus it appears that we have been too cautious in the recent past. Little harm has been done, however, as gold has yet to break out of its downtrend and Precious Metals stocks have advanced but little, compared to what may be coming soon, although it would obviously have been ideal to get in on last Monday`s reaction following the preceding Friday's clear bull hammer in gold, silver and in many stocks.

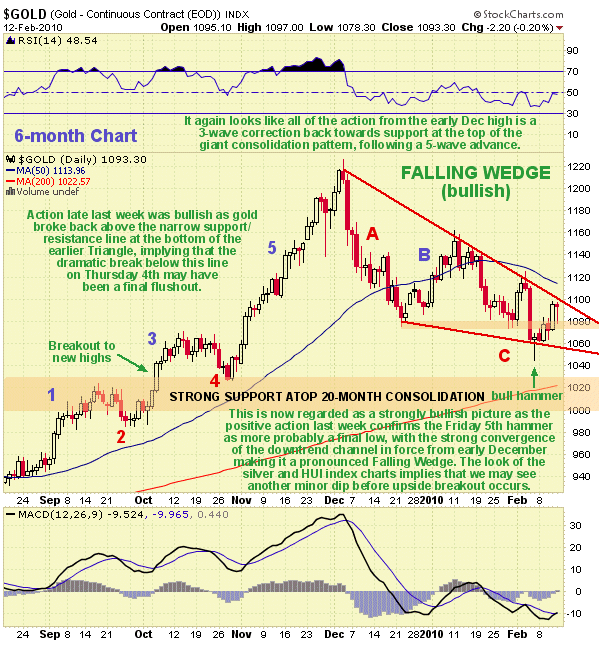
As you may recall, we had interpreted the dramatic plunge of Thursday 4th February as bearish, especially as it crashed a support level, but in the light of subsequent developments it is looking increasingly like it was a final capitulation or flushout. Gold's strength this past week, which has seen it break back clear above the support/resistance line in the $1075 - $1080 area that it broke below the previous week, means that Thursday 4th can now be chalked in as a low, and is now viewed as probably marking the end of the corrective phase. This is very important, because it means that the downtrend from early December has taken the form of a strongly converging, and thus strongly bullish, Falling Wedge, and since the price is fast approaching the apex of this Wedge it means that upside breakout is drawing near. It would thus appear that our original interpretation of the corrective action from early December as a 3-wave reaction to complement the earlier 5-wave advance, is correct, with gold's positive action from the 4th February reversal hammer strongly suggesting that the 3rd wave, the C wave, is already behind us.
Even if we only resort to plain old-fashioned common sense - you know, the sort totally absent in dealing rooms, the fact that gold has reacted back to a point just above a zone of strong support at the top of its earlier 20-month trading range, and to a point not far above its rising 200-day moving average greatly increases the chances of a powerful uptrend developing from here.
If gold now looks like it is going up, how does the rest of the sector look? You may remember that a big reason for our cautious stance in the recent past were the rather awful looking charts for silver and the PM stock indices. While we take a look at silver in the parallel Silver Market update, it is worth pointing out here that silver is on the point of breaking out of its severe downtrend, although it does look like it will probably need some more time for sentiment to recover before a major advance can get underway, and silver's COT chart has improved vastly over the past several weeks.

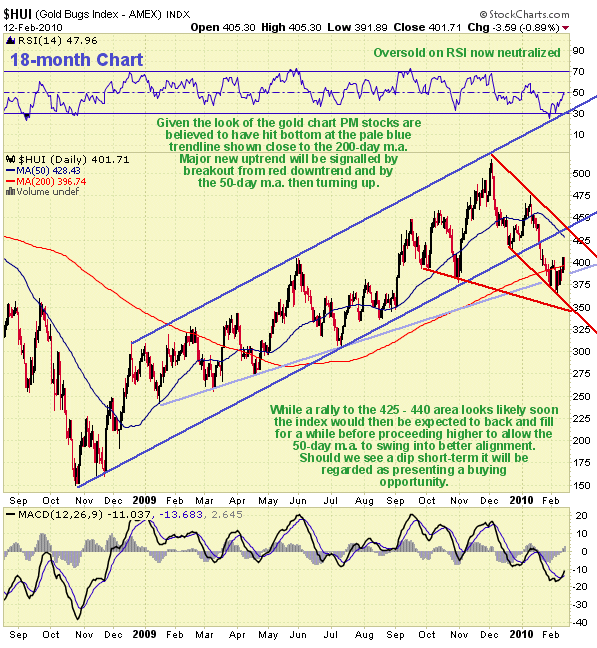
The HUI index chart, which has looked really rough for several weeks, especially as it broke down from a parallel uptrend channel in the middle of January, is showing definite signs of improvement, and it appears to have found support and stabilized in the vicinity of an (admittedly generous) trendline drawn across the lows of last January, March, April and July, which is the pale blue line drawn on our 18-month HUI index arithmetic chart shown below, and which happens to lie in the vicinity of the rising 200-day moving average. While it is certainly not "out of the woods" yet, as it has to break out above the red downtrend channel shown and above its falling 50-day moving average to restore a bullish bias, it is also true that you don't make anywhere near as much money by waiting until everthying is safe and secure and being lauded by the mainstream media. Action in this index over the past week, which is impossible to see clearly on this longer-term chart, was decidely bullish and we will examine it now on a short-term chart.

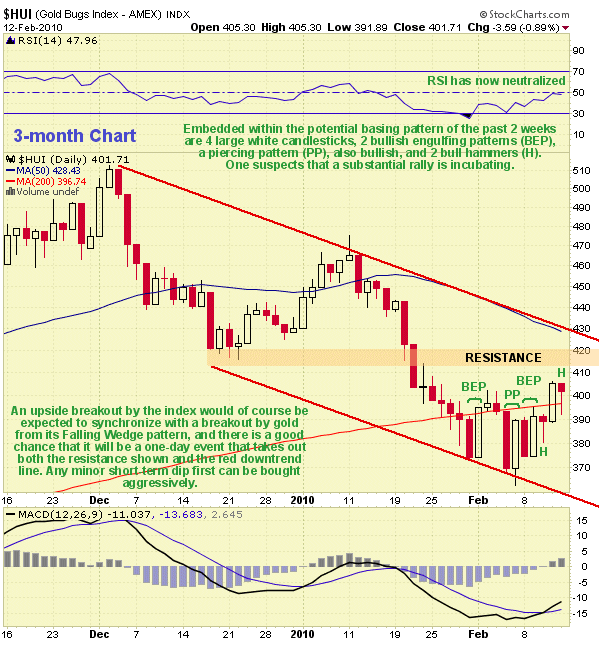
The 3-month chart for the HUI index enables us to examine recent candlestick action in detail. Here we see a plethora of bullish indications. This month so far we have already seen 4 large white candlesticks, indicating strong buying by bulls. There was a bullish engulfing pattern at the turn of the month. Then on the 4th and 5th of the month we had a bullish piercing pattern, which occurred at the time of the gold low and bull hammer. Then another bullish engulfing pattern on Monday and Tuesday, followed by bull hammers on Wednesday and Friday, punctuated by a break higher on Thursday. We should really have got in on last Monday's weakness, but "the penny hadn't dropped" at that time. That said though we haven't missed much, as the index is still technically in an intermediate base area, with the big action ahead of us, which will of course occur once gold breaks out from its Falling Wedge, whereupon we can expect the HUI index to vault above the resistance level approaching and at the 420 level and above the upper red downtrend channel line. Note that as the RSI indicator shown at the top of the chart has already neutralized, there is some chance of a minor pullback next week before upside breakout occurs, and if such a pullback occurs it will be viewed as providing a favorable buying opportunity.

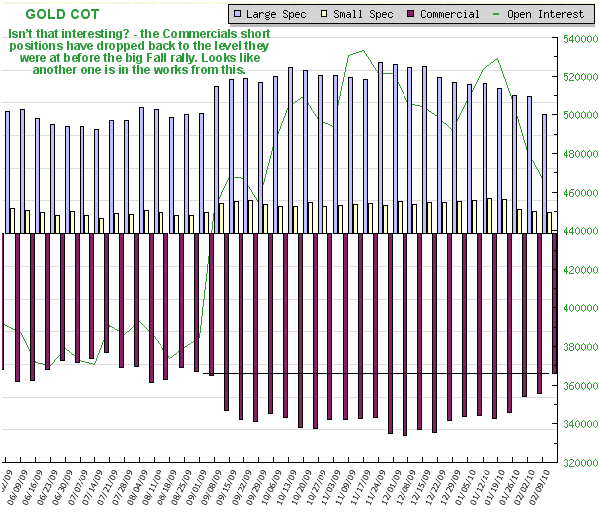
The latest COT chart shows that the Commercial short overhang, which has helped to force gold lower over many weeks, is now easing dramatically, opening the door to renewed advance. You may recall that we used analysis of the Commercial short position to predict the vicious plunge in copper prices of this month days before it started and also to call this week's strong rally in copper in an aside in the last Gold Market update.
Other circumstantial evidence suggesting that the deflationary dragon, if not slain, is likely to be held at bay for a while longer probably by another round of bailouts and QE (quantitative easing), allowing markets to resume the upward path is the powerful rebound in copper, which you may recall we sidestepped after the vicious plunge that was called on the site several days before it began, collapsing Commercial short position in Crude Oil, which we will be looking at separately and a climbing On-balance Volume line in Goldman Sachs, pointing to a surprise break to the upside. As usual Big Money appears to be positioning itself to be the winning team.
By Clive Maund
CliveMaund.com
For billing & subscription questions: subscriptions@clivemaund.com
© 2010 Clive Maund - The above represents the opinion and analysis of Mr. Maund, based on data available to him, at the time of writing. Mr. Maunds opinions are his own, and are not a recommendation or an offer to buy or sell securities. No responsibility can be accepted for losses that may result as a consequence of trading on the basis of this analysis.
Mr. Maund is an independent analyst who receives no compensation of any kind from any groups, individuals or corporations mentioned in his reports. As trading and investing in any financial markets may involve serious risk of loss, Mr. Maund recommends that you consult with a qualified investment advisor, one licensed by appropriate regulatory agencies in your legal jurisdiction and do your own due diligence and research when making any kind of a transaction with financial ramifications.
Clive Maund Archive |
© 2005-2022 http://www.MarketOracle.co.uk - The Market Oracle is a FREE Daily Financial Markets Analysis & Forecasting online publication.


