


Europe China Connection Threatens Stock Markets
Stock-Markets / Stock Markets 2010 Feb 16, 2010 - 05:19 AM GMTBy: Money_Morning

 Jon D. Markman writes: I was watching the Asia Edge show on Bloomberg television Wednesday night when the lovely and smart Susan Li broke in breathlessly on her guest with news about China's consumer inflation numbers. Inflation was reported up just a touch in January, which was considered good news because if it was higher it would have made Chinese banking authorities more anxious to clamp down on interest rates and if it was lower it would have raised the awful specter of deflation.
The Shanghai stock market ended a fraction higher, so it was a bit anticlimactic. But the key thing to know is that the Chinese market still appears to be in a downtrend and that bodes ill for the rest of the emerging markets. The 50-day moving average of iShares FTSE/Xinhua China 25 Index (NYSE: FXI) has turned emphatically negative, as has the slightly longer 100-day average. The index fund also is already beneath its 200-day average, which tends to distinguish bull cycles from bear cycles.
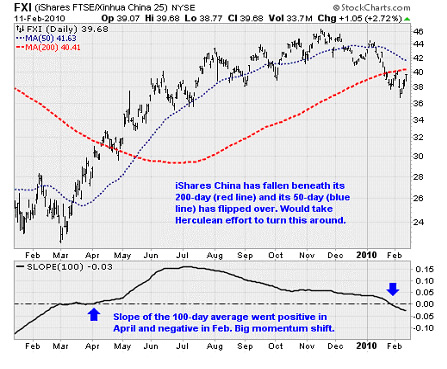
So really it's going to take a very sudden and very powerful change of heart to reverse the fortunes in Chinese stocks. The flashiest name in the region,Baidu Inc.(NASDAQ ADR: BIDU), recorded a new high last week but it appears to be the last of Mohicans, to mix regional metaphors. I am pointing all this out because China was a leader on the way up in early 2009 and we just have to pay attention to the fact that it peaked two months before the U.S. indexes in November and is now well on its way down.
Chinese stocks can certainly still pull out of this tailspin, but it has to be soon and it has to be the result of a ton of buying. If that doesn't occur, then the implication is that this is what the U.S. market will look like in two months' time.
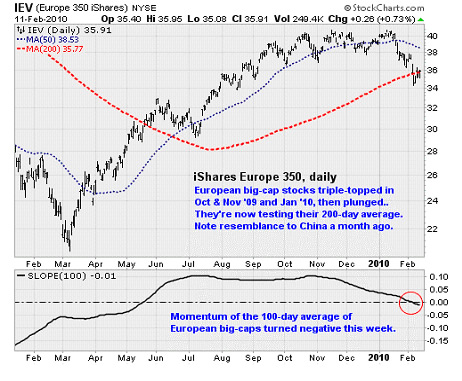
Meanwhile, over in Europe an initial resolution of the Greek debt crisis finally brought some calm. European big-cap stocks rose by a fraction. As you can see in the chart above, the European market looks a lot like China did a month ago - slipping under its 200-day average for a test. Bulls will certainly try to make sure that European stocks pass the test, but when you look at individual countries' exchanges it's not as neat a picture.
The iShares MSCI Germany Index Fund (ETF)(NYSE: EWG) andiShares MSCI France Index (ETF) (NYSE: EWQ) are already trading well under their 200-day averages and finished in the red Thursday. And theiShares MSCI Spain Index (ETF)(NYSE: EWP) is a mess. I always look for direction in Europe atBelgium andAustria because their economies are low on heavy industry and big on trade and finance. The iShares MSCI Austria Investable Mkt (ETF) (NYSE: EWO) is just now slipping into the abyss, while the iShares MSCI Belgium Investable Mkt (ETF) (NYSE: EWK) is hanging onto its bull market by its fingernails, mostly fueled by its famous and most delicious cherry-flavored beers.
I think that the message of the markets is that the so-called solution that has been reached between the European Union and Greece is tenuous at best. All that the EU has done is provided some short-term liquidity - not even close to a promise of long-term solvency.
I heard from my sources in the bond world that the trade higher was mostly just desultory short covering and that the credit bears are most certainly getting ready to rest and reload for their next raid on European credits. If successful - and let's face it, who's going to stop them - that would be euro negative and dollar positive, which in our topsy-turvy world is also U.S. equity negative. I'm really going to have to develop a secret decoder ring for these relationships and market it as an Apple Inc. (NASDAQ: AAPL) iPhone app.
The bottom line is that the developments continue to add to my confidence that a breakdown lies ahead. With world markets rolling over, the credit bears on the loose in Europe, and U.S. financial institutions likeBank of America Corp. (NYSE: BAC) andMorgan Stanley(NYSE: MS) not participating in global rallies, it is becoming ever more clear that the path of least resistance is down.
This is really strange considering our current condition of low interest rates, rising corporate earnings and super-low interest rates, so maybe stocks - which is to say the global subconscious - knows something that is not apparent on the surface.
Big Boys Move Markets
Stocks plunged and then rallied last week like diving sea birds that just wanted to grab a fish a few feet under a lake and then resurface to eat it. The fund managers who drive and manipulate the market on a day-to-day basis appeared to have a plan and they executed on it with incredible precision.
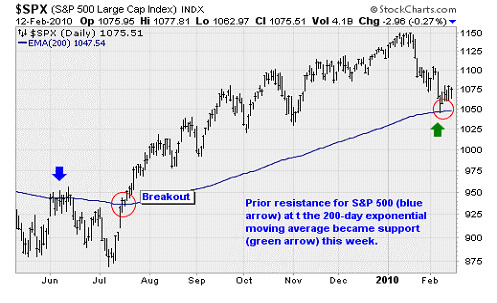
If you don't believe there was a plan, then how would you explain the fact that out of all of the million-plus places that the S&P 500 Index could have turned around, it did so on its 200-day exponential moving average, which was 1,046? If you look at the chart above, it's pretty clear that they had a spot in mind to which they would let stocks fall, and a plan to snag them there.
That level was resistance on the way up in June 2009, as you can see in the chart, and it was the breakout level a month later in July. These kinds of levels will almost always hold at least on the first test, and that is what we saw over the past week.
Traders were watching the 200-day EMA with total attention because it was in many ways a line in the sand, to switch metaphors. If the benchmark index had not stopped there, then there was really very little support beyond. A decline below this level, particularly in a panicky session, would trigger massive automated sell programs, and lead to much lower levels.
Why go through the trouble of letting stocks plunge and then buy them back a week later? Couple of things - one somewhat sinister and the other natural.
On the sinister side you have the impulse on the part of the institutions to confuse and distract the public. Volatility drives people crazy, and distracts them from comprehending the major intermediate-term trend. On the natural side, the concept of "testing" levels is ingrained among traders. Sellers were willing to drive stocks down to a level at which they should have been bought, but there's no way to tell if buyers were up to the task until that spot was reached.
In short, what we saw on Friday was bears saying, "Are ya there bulls - and what ya got?" And the bulls answered back at 3:00 pm that they were still in the game and willing to play their role.
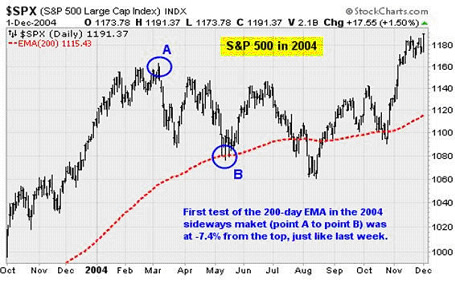
The geometry of this move down to the 200-day EMA was also interesting when you compare it to the first decline to the 200-day EMA back in 2004. Remember that year's down-biased choppiness was the analog that we are expecting to serve as something of a template for this year.
The top in 2004 was quite different than what we have seen this year, as there were three successive higher intraday highs in January through March before the decline began in earnest. But once the sideways market that year got rolling, its first slip to the 200-day EMA was -7.4% from the top. Was it just a coincidence that the decline that concluded, at least temporarily, last week, was -7.3%?
I don't believe in coincidences, except in John Irving novels.
So what comes next? After a test at an important technical level stocks can certainly bounce around a little more for further testing. (If you look closely at the chart above, there were three tests of the 200-day EMA in 2004 at Point B within five consecutive sessions.) But ultimately within a few days, if not immediately, bears are likely to step back and allow bulls passage back up for a retracement.
Odds suggest we'll see a 1.5%-3% move higher, setting up a lower high in the 1,100 to 1,120 area where there has been a ton of resistance. After that, expect a second leg of the downswing to commence. The next lower level to hold will likely be 1,020, which was the October low. After a bounce there, I suspect another new leg lower will ensue as stocks march grimly toward 950.
In short, the outlook is turning darker and the volatility is picking up. Although the year may end with a gain, getting there is going to be treacherous and hard to stomach.
Week in review:
Monday: Stocks stumbled on Monday as fears over the worsening European debt fiasco led to widespread selling of U.S. financial services companies like Bank of America Corp..Tuesday: Stocks recovered from their troubles on a classic Turnaround Tuesday following rumors that Greece would be rescued from its high-deficit fiasco. European bailout hopes were enough to overcome warnings from Standard & Poor's that the planned overhaul of U.S. financial rules could force the credit rating agency to cut its ratings on Citigroup Inc. (NYSE: C) and Bank of America Corp. The concern is that the regulatory changes would make it less likely for the mega-banks to get taxpayer support should they run into trouble again.
Wednesday: The U.S. trade deficit widened unexpectedly in December as higher oil prices and a restocking of oil inventories pushed up imports. The deficit pushed to $40.2 billion for the month, an increase on November's $35.7 billion gap. With imports up 4.8% compared to the 3.3% rise in exports - we should expect a slight drag on economic growth numbers for Q1.
Also, Federal Reserve chairman Ben Bernanke was scheduled to testify in front of Congress today regarding the central bank's plans on unwinding emergency monetary policy measures. But because of the epic snowstorm on the east coast, he sent in prepared remarks instead outlining plans to increase the interest the Fed pays to banks to park cash in its vaults as well as loan out its portfolio of Treasury bonds in exchange for cash - all with the idea of draining cash from the financial system to prevent inflation.
While Bernanke didn't really say anything new, investors didn't like to be reminded of the fact that the Fed is preparing to remove the economy from its easy-money life support. So testimony that was meant to soothe and relax investors ended up making them jumpy.
Thursday: Weekly initial jobless claims fell more than expected to 440,000 for the week ending February 6. This is down from 480,000 in the previous week. The Labor Department attributed the drop to the last remnants of the New Year holiday backlog. Still, stock investors seemed encouraged by the news, bidding stocks up throughout the session.
Friday: A heavy day of economic releases. Most importantly, January retail sales increased 0.5% month-over-month as expected, after falling 0.1% in December. Purchases of appliances and electronics played a large role in the results - suggesting consumers are feeling confident enough to splurge on larger durable goods.
Conflicting with the retail sales report, consumer sentiment for February dipped slightly to 73.7 compared to the 75 consensus estimate and the 74.4 reported in January. Assessment of current conditions actually increased, but the overall result was pulled down by a dip in future expectations - with that sub-index returning to the level that prevailed back in November.
The week ahead:
Monday: Market closed for Presidents' Day holiday.Tuesday: Empire State manufacturing index from the New York Federal Reserve Bank will provide an update on factory activity in New York State. The index has shown impressive growth: Jumping from 4.5 in December to 15.9 in January. Wall Street is looking for the February report to come in at 18. Any reading over zero indicates growth.
Wednesday: Industrial production for January will be reported. Production increased 0.6% on a month-over-month basis in both November and December. Analysts expect production to increase 0.8% based on earlier released indicators such as production worker hours in manufacturing.
Thursday: We get the first of two reads on inflation this week when the Producer Price Index for February is reported. Wall Street expected a slight increase in input prices for January as a freeze in Florida hit many crops and likely pushed up food prices.
Friday: The January Consumer Price Index will be reported. Analysts expect a 0.3% month-over-month increase compared to the 0.1% increase in December. Despite ultra-low interest rates and a flood of cash from the Federal Reserve, inflation pressures remain constrained due to high unemployment and spare factory capacity - limiting the ability of workers and producers to demand higher wages and prices.
[Editor's Note: As this analysis demonstrates, Money Morning Contributing Writer Jon Markman has a unique view of both the world economy and the global financial markets. With uncertainty the watchword and volatility the norm in today's markets, low-risk/high-profit investments will be tougher than ever to find.
It will take a seasoned guide to uncover those opportunities.
Markman is that guide.
In the face of what's been the toughest market for investors since the Great Depression, it's time to sweep away the uncertainty and eradicate the worry. That's why investors subscribe to Markman's Strategic Advantage newsletter every week: He can see opportunity when other investors are blinded by worry.
Subscribe to Strategic Advantage and hire Markman to be your guide. For more information, please click here.]
Source : http://moneymorning.com/2010/02/16/europe-china-connection/
Money Morning/The Money Map Report
©2010 Monument Street Publishing. All Rights Reserved. Protected by copyright laws of the United States and international treaties. Any reproduction, copying, or redistribution (electronic or otherwise, including on the world wide web), of content from this website, in whole or in part, is strictly prohibited without the express written permission of Monument Street Publishing. 105 West Monument Street, Baltimore MD 21201, Email: customerservice@moneymorning.com
Disclaimer: Nothing published by Money Morning should be considered personalized investment advice. Although our employees may answer your general customer service questions, they are not licensed under securities laws to address your particular investment situation. No communication by our employees to you should be deemed as personalized investment advice. We expressly forbid our writers from having a financial interest in any security recommended to our readers. All of our employees and agents must wait 24 hours after on-line publication, or 72 hours after the mailing of printed-only publication prior to following an initial recommendation. Any investments recommended by Money Morning should be made only after consulting with your investment advisor and only after reviewing the prospectus or financial statements of the company.
Money Morning Archive |
© 2005-2022 http://www.MarketOracle.co.uk - The Market Oracle is a FREE Daily Financial Markets Analysis & Forecasting online publication.