


Gold Stuck Below $1130, Waiting to Take Off
Commodities / Gold and Silver 2010 Feb 21, 2010 - 07:37 AM GMTBy: Merv_Burak

 The wedge was broken on the up side but still gold is stuck below $1130. Maybe this week it will take-off. The daily volume, however, is not encouraging.
GOLD : LONG TERM
The long term P&F chart is still in a BEAR phase and would take, at this time, a move to $1170 before it reverses its trend. That does not seem like it is in the works anytime over the next few days, but who knows?
As for our normal technical indicators, the price of gold continues to trade above its positive sloping long term moving average line. The momentum indicator remains in its positive zone and is above its positive trigger line. The volume indicator seems to be tracking a basic lateral path. It is, however, below its trigger line but the trigger is still in a positive slope. All in all, the usual indicators have gold long term rating as BULLISH.
So, we have a long term bearish trend in the P&F chart and a long term bullish rating via the usual technical indicators. Which is going to dominate? I guess we’ll just have to wait and see.
INTERMEDIATE TERM
Gold traded most of the week above its intermediate term moving average line and closed on Friday above the line. I wish I could say that the line has also turned to the up side but although it is in the process of turning on Friday it only got to the horizontal level, neither up nor down. The momentum indicator has been in its positive zone all week and remains so. It is above its positive sloping trigger line. As for the volume indicator, it has remained below its trigger line for weeks now and the trigger has turned downward. Despite the weak volume action I still have to go BULLISH as far as the intermediate term rating is concerned.
SHORT TERM
There are several interesting things on the short term chart this week. The most interesting pattern is the break through the upper wedge trend line and the subsequent action. The move seemed to have stalled but let’s check it out versus a similar move during the first week of Nov. although that move was not a wedge break-out the activity is very similar. First, there is the aggressive Stochastic Oscillator. The SO has topped out in its overbought zone and has moved below its trigger line as if heading lower to suggest a reversal of trend ahead. BUT in Nov we had the same thing and that was just a teaser while the price broke higher on the next Monday and continued upward for some time. The SO just ended moving sideways until its decisive reversal in early Dec. The difference between the two periods seems to be two fold. First, we have a previous resistance shown at this latest activity. Also this latest activity seems to be more volatile as the daily range of activity is a lot more than the earlier period. What this will do to the move is anyone’s guess but the Monday activity should tell us what’s what.
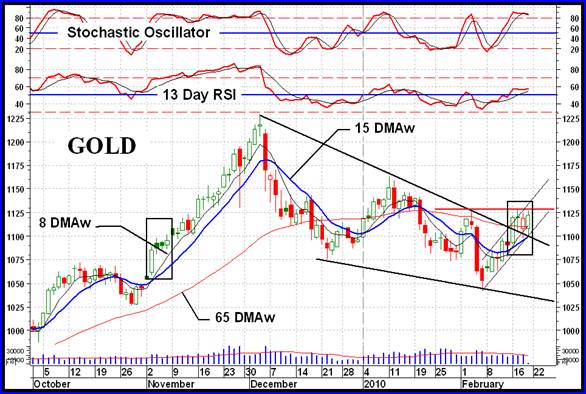
As for the usual indicators, they are quite positive. The gold price remains above its short term positive sloping moving average line. The momentum indicator is in its positive zone above its positive trigger line. The one somewhat negative is the volume action. It remains weak and below the average level of the past 15 days. As with the intermediate term, despite the weak volume action I can only rate the short term as BULLISH. The very short term moving average line has moved above the short term line for confirmation of the bull.
As for the immediate direction of least resistance, that would be to the up side. Great reliance on the previous example from Nov along with the direction of the very short term moving average line causes me to go that route. Monday is probably very important as verification of this assessment and the assessment of the short term trend.
SILVER
From time to time I throw in some hints to highlight some technical considerations on a chart. The silver P&F chart has two such considerations that very often occur in P&F charts. First, we see the solid blue up trending lines. These lines show how we move the up trend line further towards the right when the action crosses below the line but DOES NOT reverse the trend. For that we need the second criteria, the move below two previous lows. The other interesting chart information is what is often referred to as the resistance trend lines during an up trend. These you see as light red lines (solid or dashed). These are drawn from the first row of Os to the left of an upside break. Because of the wide consolidation area before the initial upside break the initial resistance line was quite a ways away from the upside action. On the next break, at the $14 level, we can draw a closer resistance (red dash) line. We see how well this line has done during the subsequent action. Although these resistance lines are not perfect one would be taking extra risks one does not need when they buy in while the action is near the resistance line. The reverse is true at support lines during down trends (the light blue line).
Just a couple of technical hints while using P&F charts.
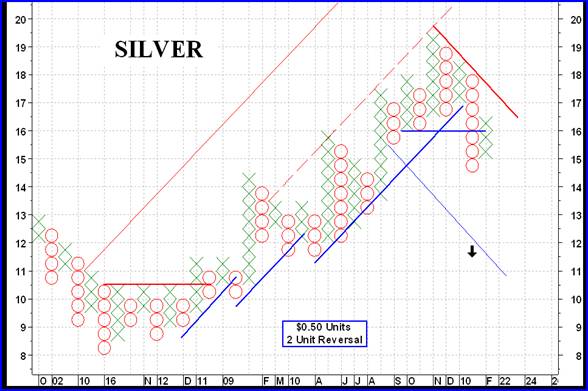
As the P&F chart shows, we are still in a basic down trend with a projection calculated to the $11.50 level. That’s just a guide, not a certainty.
As for the usual indicators, on the long term silver is still below its negative long term moving average line. The momentum indicator, however, has just moved into its positive zone above its positive trigger line. The volume indicator is still quite negative and below its negative sloping trigger line. The best I can give the long term rating is a – NEUTRAL rating, one level above a full bear.
On the intermediate term things are still a little worse. Silver is below its negative sloping moving average line. The momentum indicator is still in its negative zone but has moved above its positive sloping trigger line. The volume indicator is still negative with the indicator below its negative sloping trigger line. The intermediate term rating is BEARISH.
On the short term things are somewhat brighter. Silver is above its positive sloping short term moving average line. The momentum indicator has just moved into its positive zone above a positive sloping trigger line. The daily volume activity is somewhat neutral at the present although it does look like it wants to improve over the average for the past 15 days. The short term rating is BULLISH. The very short term moving average line moving above the short term line confirms the bull.
As for the direction of least resistance, the up side looks like the direction for the same reasons as for gold.
PRECIOUS METAL STOCKS
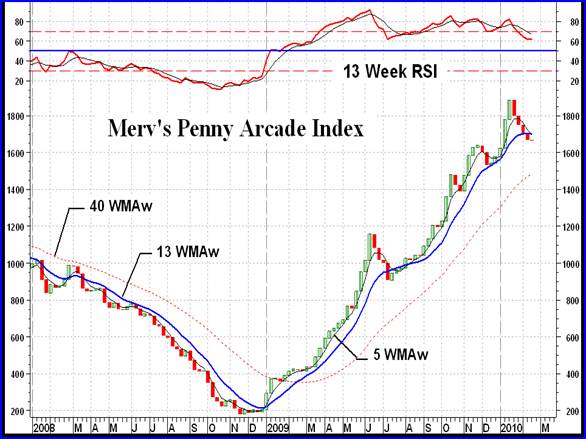
The Merv’s Penny Arcade Index is still acting a little worse than most of the other Merv’s or North American Indices are. This has not yet generated into a bear signal. It is still far from it on the long term but getting close on the intermediate term. The action over the past few weeks has been very similar to its action at mid point in the recent bull trend. This may just be another “step” up the latter of a major bull move or it could be the start of more difficult times for the penny stocks. One year, one month and two weeks ago the bull market in the pennies was confirmed (the low was a few weeks earlier). Since then the average price performance of the 30 component stocks is over 700%, this is an average of 30 stocks some of which have done a lot better while others have done a lot worse. You need to know what’s moving and what’s not to get in on such performance. The latest technical information and ratings for the 30 component stocks can be found in the subscriber’s section of the Precious Metals Central service.
Apart from the Penny Arcade Index which declined 0.2% on the week all other Merv’s Indices and major North American Indices were up on the week. The short term ratings for most Indices are therefore bullish while for the intermediate and long term we still have some problems. Although we have had a few upside weeks it still does not appear to be time to get too bullish on the precious metal stocks. Maybe next week.
Merv’s Precious Metals Indices Table
Well, that will be it for this week.
By Merv Burak, CMT
Hudson Aero/Systems Inc.
Technical Information Group
for Merv's Precious Metals Central
For DAILY Uranium stock commentary and WEEKLY Uranium market update check out my new Technically Uranium with Merv blog at http://techuranium.blogspot.com .
During the day Merv practices his engineering profession as a Consulting Aerospace Engineer. Once the sun goes down and night descends upon the earth Merv dons his other hat as a Chartered Market Technician ( CMT ) and tries to decipher what's going on in the securities markets. As an underground surveyor in the gold mines of Canada 's Northwest Territories in his youth, Merv has a soft spot for the gold industry and has developed several Gold Indices reflecting different aspects of the industry. As a basically lazy individual Merv's driving focus is to KEEP IT SIMPLE .
To find out more about Merv's various Gold Indices and component stocks, please visit http://preciousmetalscentral.com . There you will find samples of the Indices and their component stocks plus other publications of interest to gold investors.
Before you invest, Always check your market timing with a Qualified Professional Market Technician
Merv Burak Archive |
© 2005-2022 http://www.MarketOracle.co.uk - The Market Oracle is a FREE Daily Financial Markets Analysis & Forecasting online publication.