Economic Recovery and the Price of Gold
Commodities / Gold and Silver 2010 Feb 22, 2010 - 09:01 AM GMTBy: Clif_Droke

 What a difference a month makes! It was only a month ago a leading financial publication came out with the story, "U.S. economy still hemorrhaging jobs despite stimulus." The press was all over the employment data and concluded that the stimulus had utterly failed. They were of course making the classic mistake of treating the employment numbers as coincident indicators, when in fact employment is the ultimate lagging indicator.
The stock market, by contrast, was telling a much better story for the economy. As we've emphasized several times in recent months, the 10 month-plus recovery rally in the S&P 500 Index was the ultimate leading indicator for telling us that the economy, and by extension the employment situation, would recover. The fabled Dow Theory "6-9 month recovery" rule was projecting an economic turnaround and has never once failed in its positive implication for the economy. It's starting to look like the 6-9 month rule has lived up to its billing once again as the recovery in the stock market has preceded the nascent economic recovery.
The latest headline in the Wall Street Journal drew attention to the improvement in factory hiring. Makers of motor vehicles, shoes and electronics were among the key industries to add employees in the last 60 days, according to WSJ, as industrial output rose for the seventh consecutive month.
The WSJ reminds us, however, that while the economy may be rebounding, sentiment on the economic outlook is still overly cautious. According to the article, "[S]ome still fear a secondary slump, especially if a broader recovery -- which will rely on still-elusive job creation in the wider economy and a stronger revival of consumer spending -- is delayed." That kind of negative sentiment is promising from a contrarian standpoint, especially with Fed funds rates still well under 1%.
In the article, Craig LaBarge, a chief executive of an electronics manufacturer, was quoted as saying, "Order inflow has really improved compared to a year ago. The thing that's hard for us to determine in some of the markets is how much of this is just inventory replenishment and how much is real and market demand."
I would respond to that by asking, "Does it matter?" It has been observed that inventory levels plunged well before the recession began, which is something you rarely if ever see. Normally, inventories begin falling after a recession becomes established. But in the latest recession the falling inventories led the way down. Now that inventory replenishment has begun, it should also help to stimulate the real demand that Mr. LaBarge referred to. Inventory replenishment, in other words, can easily become self-fulfilling in terms of creating economic demand and, eventually, employment.
In a recent interview with Barron's, James Paulsen, the chief strategist with Wells Capital Management, opines that the economy could benefit from a "prolonged positive impact from inventory rebuilding that will be comparable to 1982, when inventories boosted GDP for some five straight quarters of that recovery." Paulsen points out that this time around "we've only stopped liquidating inventories at such a rapid rate as in early 2009, so the rebuild lies ahead." According to Paulsen, the "wild-card factor" of inventory replenishment alone could help push GDP growth from 3-4% to 5%.
The lingering pessimism over the recovery will only increase the chances of the recovery's sustainability inasmuch as it should keep policy makers "on point" and thereby lessen the chances that they'll repeat mistakes that led to the credit crisis. The longer the economy is allowed room to breathe without the shackles of a tight money policy, the better its chances for recovery will be.
Gold Market
With the latest interim recovery attempt underway, stocks across the board were able to make some gain in the several days. Basic materials and mining shares have been relative laggards in the incipient recovery, however, leading many investors to wonder if this time around – assuming the recovery accelerates – will the commodity stocks be left behind? Let's examine a couple of scenarios that are pertinent to this question.
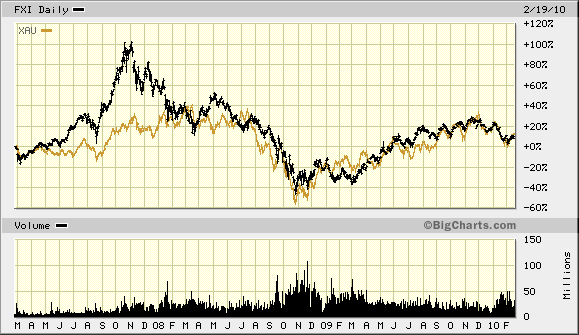
Our first consideration for answering this question involves a comparison of the China stock group with the metals and mining shares. At first glance you might be tempted to conclude that the China stock market outlook isn't relevant to the gold/silver and PM mining share outlook. A closer look reveals a strong correlation in recent years between strength and weakness in the China stocks and the strength or weakness in the mining shares. Even a cursory examination of the chart shown below, which compares the China ETF (FXI) with the XAU Gold Silver Index, reveals a trend wherein the China stock group tends to lead the gold/silver shares at pivotal turning points. In recent years the China stocks have enjoyed a leadership position over the PM mining shares, a trend that has been evident even in the most recent correction in December-January.

The significance of this correlation among the China stocks and the miners is obvious: China has had a voracious appetite for both industrial and precious metals in recent years and has been a leading consumer. Strength in China's industrial economy has always translated into strong demand for gold and silver, the former for its investment potential and the latter more for its industrial applications. Recently, however, China has embarked on a monetary tightening policy in response to a developing real estate bubble. China's central bank has increased the key interest rate and this has many investors wondering if a tightening monetary policy will translate into a weaker Chinese economy.
This in turn would have some negative implications for key industrial commodity prices and the gold and silver prices wouldn't be exempt. It's important that we keep an eye on the China ETF (FXI) in the near term and particularly the China stock internal momentum indicators (shown below). Improvement in China stock internal momentum will be the first positive sign pointing to a recovery in demand for not only China shares but also, ipso facto, healthy and vibrant demand for the precious metals mining stocks.
Another consideration is that in the past, the precious metals -- particularly the gold price -- along with the PM mining shares, have typically either led or confirmed strength following broad market declines. Whenever the gold price has led the broad market S&P 500 Index (SPX) following a correction you could make the generally safe assumption that the metals were going to strongly participate in the subsequent interim recovery phase, either as leader or else equals with the other major sectors. Following the latest correction gold price, and especially silver, hasn't been reflecting the strength we've come to expect following interim corrections.
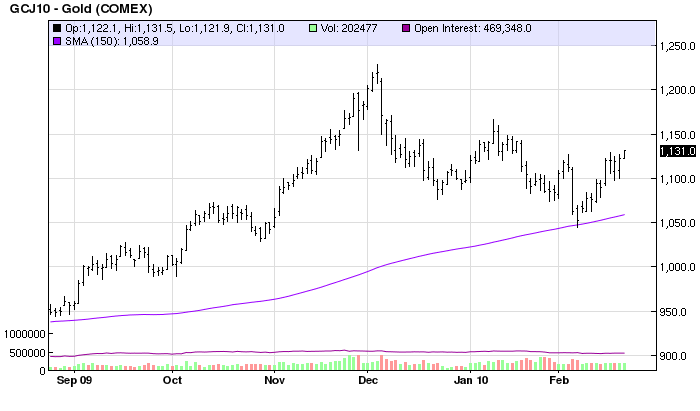
At this point in the recovery rally the metals and mining shares are relative laggards compared to other major sectors. Traders are focused on the January closing high of $1,152, which is a key benchmark for the near term gold outlook. Unless this level is overcome soon we could be in for a prolonged period of consolidation in the metals sector as we await the next China recovery or PM bull market phase.

Silver Trading Techniques
With the precious metals long-term bull market well underway, many independent traders and investors are looking for ways to capitalize on short-term and interim moves in the metals. Realizing that the long-term “buy and hold” approach isn’t always the best, many are seeking a more disciplined, technical approach for realizing gains in the market for metals and the PM mining shares.
It’s for that reason that I wrote “Silver Trading Techniques” back in 2005. My goal in writing this book was to provide traders with some reliable trading indicators for anticipating and capturing meaningful moves in the price for silver and the silver mining shares. Included in this guide are rules for using the best moving averages when trading silver stocks, how to spot a turnaround in the silver stocks before it happens (best-kept secret!), how to tell when a silver stock has topped and which moving average crossovers work and which don't . Also explained are the best technical indicators for capturing profitable swings in silver and silver stocks and how to apply them.
You won't find these techniques in a copy of Edward's & Magee's book on technical analysis or anywhere else. These reliable "tricks of the trade" are available to you in Silver Trading Techniques. Click here to order:
http://www.clifdroke.com/books/silvertrading.mgi
All orders for the book will receive an additional copy of the recently published, “Gold Stock Trading Techniques,” which contains reliable strategies for short-term technical trading in the gold mining shares with an emphasis on safety and capital preservation.
By Clif Droke
www.clifdroke.com
Clif Droke is the editor of the daily Gold & Silver Stock Report. Published daily since 2002, the report provides forecasts and analysis of the leading gold, silver, uranium and energy stocks from a short-term technical standpoint. He is also the author of numerous books, including 'How to Read Chart Patterns for Greater Profits.' For more information visit www.clifdroke.com
Clif Droke Archive |
© 2005-2022 http://www.MarketOracle.co.uk - The Market Oracle is a FREE Daily Financial Markets Analysis & Forecasting online publication.


