Stock Market Volatility Rises as S&P 500 Nears March Low
Stock-Markets / Volatility Feb 25, 2010 - 12:02 PM GMTBy: Donald_W_Dony
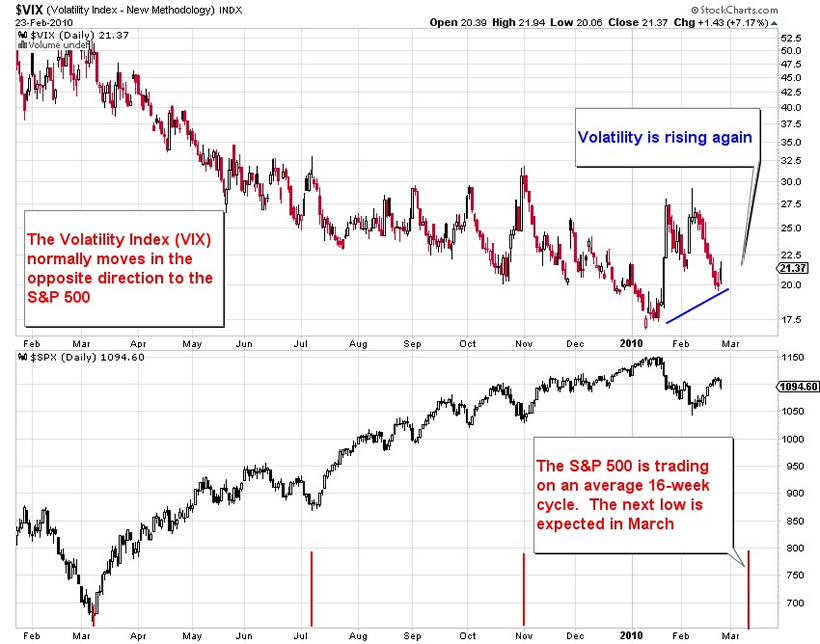
 Probability models (Monte Carlo) suggest that there is a 70% chance of the next key low developing in March for the S&P 500.

Additional supporting evidence for short-term downward pressure is also present in the Volatility Index (VIX) and in the Carry Trade.
VIX is the ticker symbol for the Chicago Board Options Exchange Volatility Index, a popular measure of the implied volatility of S&P 500 index options. A rising value corresponds to a more volatile market and therefore more costly options. Often referred to as the Fear Index, it represents one measure of the market's expectation of volatility over the next 30 day period. The VIX trades in the opposite direction to the S&P 500. The trend since January has turned up. This implies that there is greater short-term risk of holding stocks.
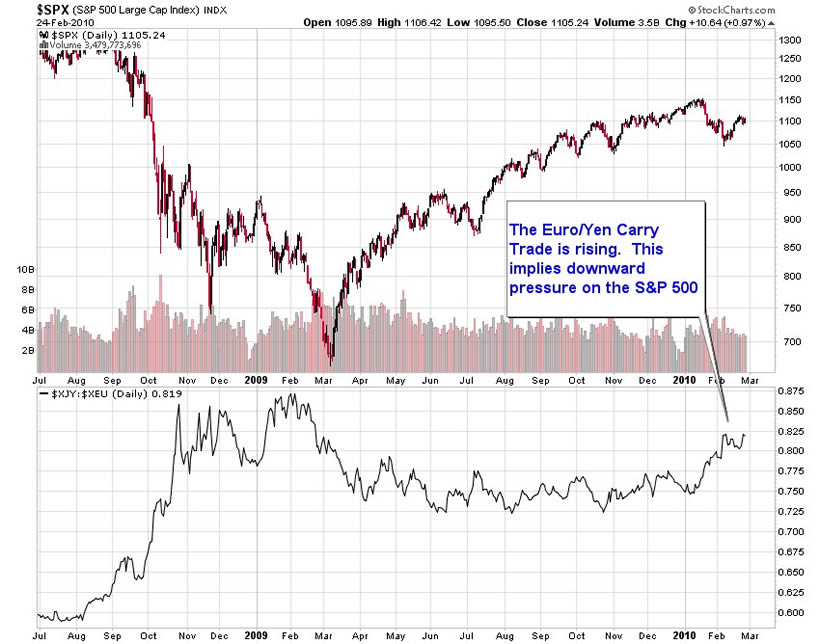
The Carry Trade is another element that is indicating a probability of lower numbers for the broad-based equity index. A rising Euro/Yen cross signals an opposite reaction can be expected in the S&P 500.

The Carry Trade is a near endless source of capital for traders. However, as the Japanese Yen advances in price, the trade becomes less profitable, which means a decreasing amount of funds are being used to purchase securities.
Bottom line: There is evidence that the S&P 500 should continue its downward bias during the next 1 to 3 weeks. Cycle models indicate that the S&P 500 is trading on an average 16-week pattern. The last three lows were in March, July and November. The next trough is anticipated in mid-March.
Investment approach: Investors may wish to wait until the expected low in March develops before committing additional funds to their portfolios. This dip is anticipated to be shallow and may create better price levels for many securities.
Your comments are always welcomed.
By Donald W. Dony, FCSI, MFTA
www.technicalspeculator.com
COPYRIGHT © 2010 Donald W. Dony
Donald W. Dony, FCSI, MFTA has been in the investment profession for over 20 years, first as a stock broker in the mid 1980's and then as the principal of D. W. Dony and Associates Inc., a financial consulting firm to present. He is the editor and publisher of the Technical Speculator, a monthly international investment newsletter, which specializes in major world equity markets, currencies, bonds and interest rates as well as the precious metals markets.
Donald is also an instructor for the Canadian Securities Institute (CSI). He is often called upon to design technical analysis training programs and to provide teaching to industry professionals on technical analysis at many of Canada's leading brokerage firms. He is a respected specialist in the area of intermarket and cycle analysis and a frequent speaker at investment conferences.
Mr. Dony is a member of the Canadian Society of Technical Analysts (CSTA) and the International Federation of Technical Analysts (IFTA).
Donald W. Dony Archive |
© 2005-2022 http://www.MarketOracle.co.uk - The Market Oracle is a FREE Daily Financial Markets Analysis & Forecasting online publication.


