UK House Prices Fall 1% in February, Hit by Snow
Housing-Market / UK Housing Feb 26, 2010 - 08:17 AM GMTBy: Nationwide
 •House prices fell by 1.0% month-on-month in February
•Price decline may be explained by snowy weather and expiry of stamp duty holiday
•Too early to say whether February’s drop is start of a new trend

Commenting on the figures Martin Gahbauer, Nationwide's Chief Economist, said:
“The price of a typical UK property fell by a seasonally adjusted 1.0% month-on-month (m/m) in February, ending a strong run of nine consecutive monthly increases. The relatively smoother three month on three month rate of inflation remained positive at +1.6%, though this is down from +2.0% in January and a peak of +3.7% in September 2009. The annual rate of price inflation still managed to increase from 8.6% to 9.2% year-on-year, as this month’s fall was smaller than the 1.5% m/m decline recorded in February 2009. The average price of a typical property sold in the UK during February was £161,320.
One-off factors may have played a role in February
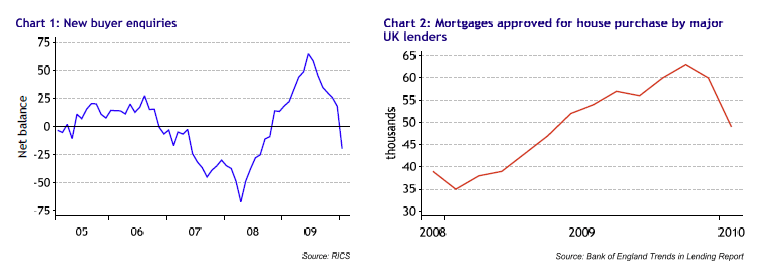
“There is evidence from a range of indicators that the market may have lost momentum in early 2010 as the stamp duty holiday ended and house hunters were obstructed by the icy weather. New buyer enquiries dropped sharply in the New Year and there was also an associated drop in the number of new mortgages taken out by homebuyers in January. This drop in demand seems to have fed into agreed prices during February.
Judging from the fall in retail sales during January, however, the housing market does not appear to be the only sector of the economy to have experienced a setback related to adverse weather and the expiry of economic stimulus measures. At this stage, it is difficult to gauge how much of the drop in housing activity is attributable to one-off factors and therefore whether February’s fall in prices is just a temporary blip or the start of a new trend.

“Even without the impact of stamp duty changes and the snowy weather, it would have been surprising to see house prices maintain the very strong upward momentum seen for most of 2009. In light of low growth in household incomes and elevated levels of unemployment, house prices were beginning to move ahead of the recovery in general economic conditions. With the longer term stability of the market in mind, it would be a positive development for house prices not to become decoupled from the economic fundamentals. A pause in the upward trend will also be a relief to potential first-time buyers who are no longer benefiting from the stamp duty holiday and for whom affordability had begun to deteriorate again over the course of 2009.
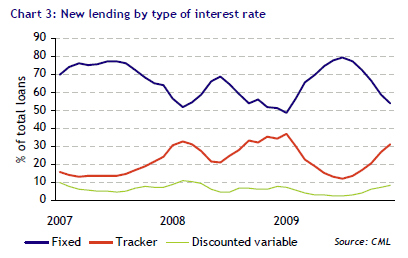
Increase in borrowers taking out variable rate deals over fixed
“Since the middle of 2009, there has been a steady increase in the proportion of new loans being taken out at variable rather than fixed rates. In July, the proportion of new loans taken out on base rate tracker or discounted variable rate deals hit a low of just 14%. By December it had risen to 39%, with the proportion of fixed rate deals dropping from 80% to 54% over the same period.
 “It is not yet clear what has driven the steady increase in preference for variable rate deals. One possibility is that borrowers believe that base rate will remain low for longer than they did in July, making them more willing to take on interest rate risk over the course of the deal period. The relatively dovish messages coming out of recent Bank of England Inflation Reports are supportive of this explanation. Another possibility is that as house prices rose considerably over the course of 2009, new borrowers increasingly preferred to take out cheaper variable rate deals in order to keep their initial mortgage payments relatively low.
According to Bank of England figures, there is currently a 1.58 percentage point gap between fixed and variable rate deals. This difference is largely due to the steepness of the UK yield curve, with rates on longer term government bonds much higher than those on short-term borrowing. As long as the yield curve remains steep, the proportion of homebuyers preferring variable rate deals may stay relatively high, even though the next move in the base rate is much more likely to be up rather than down.”
| Martin Gahbauer Chief Economist Tel: 01793 655434 fionnuala.earley@nationwide.co.uk |
Roy Beale Media Relations Officer Tel: 01793 655689 roy.beale@nationwide.co.uk |
Notes: Indices and average prices are produced using Nationwide's updated mix adjusted House Price Methodology which was introduced with effect from the first quarter of 1995. Price indices are seasonally adjusted using the US Bureau of the Census X12 method. Currently the calculations are based on a monthly data series starting from January 1991. Figures are recalculated each month which may result in revisions to historical data. The Nationwide Monthly House Price Index is prepared from information which we believe is collated with care, but no representation is made as to its accuracy or completeness. We reserve the right to vary our methodology and to edit or discontinue the whole or any part of the Index at any time, for regulatory or other reasons. Persons seeking to place reliance on the Index for their own or third party commercial purposes do so entirely at their own risk. All changes are nominal and do not allow for inflation. More information on the house price index methodology along with time series data and archives of housing research can be found at www.nationwide.co.uk/hpi
Nationwide Archive |
© 2005-2022 http://www.MarketOracle.co.uk - The Market Oracle is a FREE Daily Financial Markets Analysis & Forecasting online publication.


