Most Popular
1. It’s a New Macro, the Gold Market Knows It, But Dead Men Walking Do Not (yet)- Gary_Tanashian
2.Stock Market Presidential Election Cycle Seasonal Trend Analysis - Nadeem_Walayat
3. Bitcoin S&P Pattern - Nadeem_Walayat
4.Nvidia Blow Off Top - Flying High like the Phoenix too Close to the Sun - Nadeem_Walayat
4.U.S. financial market’s “Weimar phase” impact to your fiat and digital assets - Raymond_Matison
5. How to Profit from the Global Warming ClImate Change Mega Death Trend - Part1 - Nadeem_Walayat
7.Bitcoin Gravy Train Trend Forecast 2024 - - Nadeem_Walayat
8.The Bond Trade and Interest Rates - Nadeem_Walayat
9.It’s Easy to Scream Stocks Bubble! - Stephen_McBride
10.Fed’s Next Intertest Rate Move might not align with popular consensus - Richard_Mills
Last 7 days
Friday Stock Market CRASH Following Israel Attack on Iranian Nuclear Facilities - 19th Apr 24
All Measures to Combat Global Warming Are Smoke and Mirrors! - 18th Apr 24
Cisco Then vs. Nvidia Now - 18th Apr 24
Is the Biden Administration Trying To Destroy the Dollar? - 18th Apr 24
S&P Stock Market Trend Forecast to Dec 2024 - 16th Apr 24
No Deposit Bonuses: Boost Your Finances - 16th Apr 24
Global Warming ClImate Change Mega Death Trend - 8th Apr 24
Gold Is Rallying Again, But Silver Could Get REALLY Interesting - 8th Apr 24
Media Elite Belittle Inflation Struggles of Ordinary Americans - 8th Apr 24
Profit from the Roaring AI 2020's Tech Stocks Economic Boom - 8th Apr 24
Stock Market Election Year Five Nights at Freddy's - 7th Apr 24
It’s a New Macro, the Gold Market Knows It, But Dead Men Walking Do Not (yet)- 7th Apr 24
AI Revolution and NVDA: Why Tough Going May Be Ahead - 7th Apr 24
Hidden cost of US homeownership just saw its biggest spike in 5 years - 7th Apr 24
What Happens To Gold Price If The Fed Doesn’t Cut Rates? - 7th Apr 24
The Fed is becoming increasingly divided on interest rates - 7th Apr 24
The Evils of Paper Money Have no End - 7th Apr 24
Stock Market Presidential Election Cycle Seasonal Trend Analysis - 3rd Apr 24
Stock Market Presidential Election Cycle Seasonal Trend - 2nd Apr 24
Dow Stock Market Annual Percent Change Analysis 2024 - 2nd Apr 24
Bitcoin S&P Pattern - 31st Mar 24
S&P Stock Market Correlating Seasonal Swings - 31st Mar 24
S&P SEASONAL ANALYSIS - 31st Mar 24
Here's a Dirty Little Secret: Federal Reserve Monetary Policy Is Still Loose - 31st Mar 24
Tandem Chairman Paul Pester on Fintech, AI, and the Future of Banking in the UK - 31st Mar 24
Stock Market Volatility (VIX) - 25th Mar 24
Stock Market Investor Sentiment - 25th Mar 24
The Federal Reserve Didn't Do Anything But It Had Plenty to Say - 25th Mar 24

Market Oracle FREE Newsletter

How to Protect your Wealth by Investing in AI Tech Stocks

Use Bar Chart Patterns To Spot Trade Setups

InvestorEducation / Learn to Trade Feb 26, 2010 - 11:50 AM GMT

By: EWI

InvestorEducation

Best Financial Markets Analysis ArticleHow a 3-in-1 chart formation in cotton foresaw the January selloff

By Nico Isaac

For Elliott Wave International's chief commodity analyst Jeffrey Kennedy, the single most important thing for a trader to have is STYLE-- and no, we're not talking business casual versus sporty chic. Trading "style," as in any of the following: top/bottom picker, strictly technical, cyclical, or pattern watcher.


Jeffrey himself is, and always has been, a "trend" trader; meaning: he uses the Wave Principle as his primary tool, along with a few secondary means of select technical studies. Such as: Bar Patterns. And, of all of those, Jeffrey counts one bar pattern in particular as his absolute, all-time favorite: the 3-in-1.

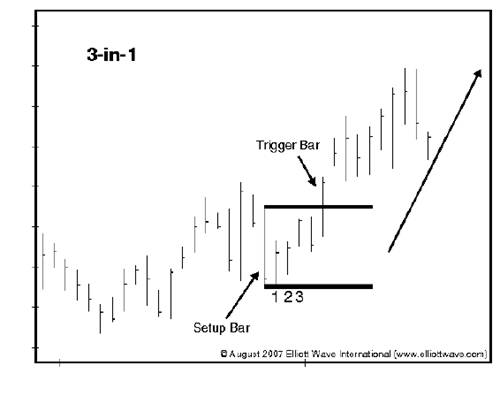
Here's the gist: The 3-in-1 bar pattern occurs when the price range of the fourth bar (named, the "set-up" bar) engulfs the highs and lows of the preceding three bars. When prices move above the high or below the low of the set-up bar, it often signals the resumption of the larger trend. The pouit where this breach occurs is called the "trigger bar." On this, the following diagram offers a clear illustration:
For a real-world example of the 3-1 formation in the recent history of a major commodity market, take a look at this close-up of Cotton from Jeffrey Kennedy's February 5, 2010, Daily Futures Junctures.
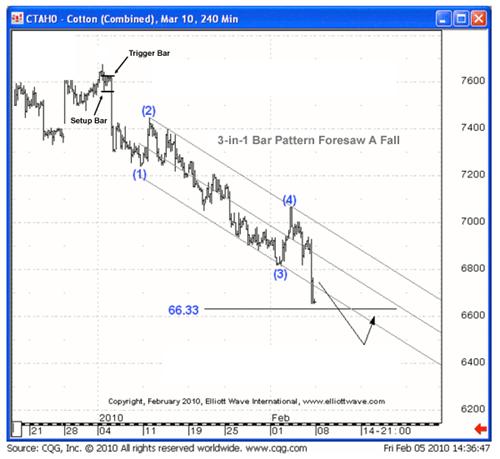
As you can see, a classic 3-in-1 bar pattern emerged in Cotton at the very start of the new year. Then, within days of January, the trigger bar closed below the low of the set-up bar, signaling the market's return to the downside. Immediately after, cotton prices plunged in a powerful selloff to four-month lows.

Then February arrived and with it, the end of cotton's decline. In the same chart, you can see how Jeffrey used the Wave Principle to calculate a potential downside target for the market at 66.33. This area marked the point where Wave (5) equaled wave (1), a common relationship. Since then, a winning streak in cotton has carried prices to new contract highs.

What this example tells you is that by tag-teaming the Wave Principle with Bar Patterns, you can have a higher objective chance of pinning the volatile markets to the ground.

To learn more, read Jeffrey Kennedy's exclusive, free 15-page report titled "How To Use Bar Patterns To Spot Trade Set-ups," where he shows you 6 bar patterns, his personal favorites.

Nico Isaac writes for Elliott Wave International, a market forecasting and technical analysis firm.


© 2005-2022 http://www.MarketOracle.co.uk - The Market Oracle is a FREE Daily Financial Markets Analysis & Forecasting online publication.


Post Comment

Only logged in users are allowed to post comments. Register/ Log in