


Intraday and Swing Trading Gold and Stocks – How To Use Multiple Time Frames For Setups
Stock-Markets / Stock Index Trading Feb 27, 2010 - 05:20 AM GMTBy: Chris_Vermeulen

 Acouple months ago I started providing more of my intraday charts in hopes to educate traders on current market conditions so they feel like they are “in the zone” for trading. It’s crucial to understand the intraday moves and volume levels if you want to be consistently profitable trader. It doesn’t matter whether you are day trading or swing trading, you must be following daily and intraday charts.
I have been getting a few subscribers asking me: “Why I jump around from time frame to time frame so much?”
It’s a great question as some days I’m using the 60 minute charts, another day the 2 hour chart, and another the daily chart etc… well I hope to answer this question within this education report.
Trading Time Frames & Their Characteristics
Length of Trades – The longer the time frame you are trading the longer the trade will last on average. For example, if you are swing trading using the daily chart most trades will last 2-20 days, but if you are trading the 60 minute chart, then a trade may only last a few hours. Knowing this allows you to be more or less active depending on the market conditions or the amount of time you are available to trade.
Risk Levels/Draw Downs – The longer the time frame the more potential risk/draw down you will have. For example, when trading the daily chart you may set your protective stop below the previous days low. Depending on the investment, that could be $1-$50 per share or contract. Now compare this to someone trading the 5 minute intraday chart playing volume breakouts to generate quick gains. This person’s risk/draw down may only be 5-50 cents per share or contract.
This is the main reason why short term intraday traders play with larger amounts of money. Simply because their risk is so much lower, they can put more on the line for quick profits. On the flip side, swing traders should be trading much smaller positions to compensate for the increased risk.
Individual Personalities
Every trader sees the market in a completely different way because each of our brains process chart patterns and time frames differently. This is exactly what creates the market, everyone buy and selling at different times creating liquidity and the random chart movements.
The hardest part about trading in my opinion is figuring out what type of trading personality you have? It took me a few years to actually figure this out, but now I know exactly what type of trading strategies I’m good at and which time frames I prefer trading.
Myself, I like swing trading because it does not require a lot of time to follow the market, and trades last several days and sometimes weeks. But I also like to take advantage of the market when volatility rises and the market becomes choppy because this is when intraday trading becomes most profitable, in my opinion.
Personally I do not want to trade every day because it’s a ton of work and stressful. Rather, I prefer to sit back and cherry pick, only taking positions when I see a perfect setup. This way my win/loss ratio is very high, and I do not need to worry about finding trades every day or week.
Quick Note: When I am trading the intraday charts my focus is to find setups on the 60 minute, 2 hour, 4 hour an 8 hour charts. The reason behind this is that these longer intraday time frames provide very accurate trades and each trade lasts a few hours and sometimes a few days. Trading shorter time frames like the 5 minute chart is torture because you end up trading all day every day and to be honest that’s a lot of work and not fun at all.
So here are some charts showing you how different time frames show you different patterns, insight and setups:
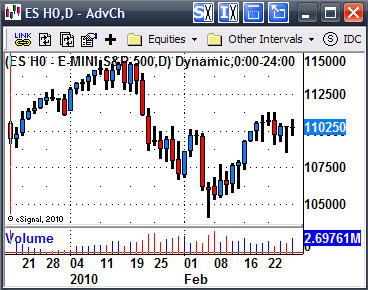
SP500 Mini Futures contract – Daily Chart
Looking at the past 7-8 days we don’t really see anything exciting to trade as far as chart patterns go. So we sit and wait for something to unfold in a few days if we are lucky.
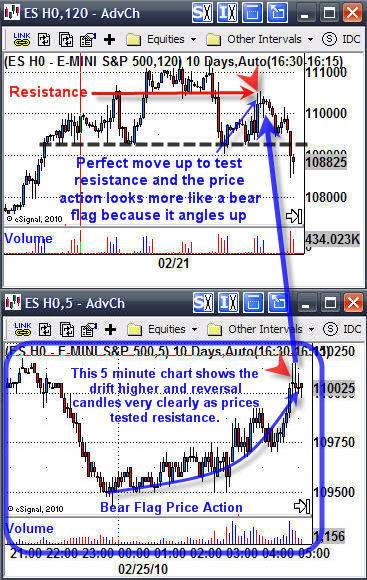
SP500 Mini Futures – 2 Hour Intraday Trading Chart
What do you see? WOW a big fat head and shoulders pattern which indicates we should see lower prices.
Traders should have been looking to go short when the price was trading at this resistance level and the 5 minute chart confirmed resistance with the long upper candle wicks (reversal candles) shown in the charts below.
Important Note: When entering this trade, we did not know for sure it was going to be a head & shoulders pattern, but there was a high probability of it happening because of the previous couple day’s price action.
Notice how the left shoulder rallied up and got slammed by sellers, then the next rally (the head) also got slammed by sellers. This price action is bearish as institutions, hedge funds etc… dump positions once they have attained their profit goals for certain investments.
The next rally (right shoulder) drifted up slowly to test the previous resistance level. But look at how the price moved higher…. It drifted higher, which is bearish.
So, if buyers were still in control then we would have seen the price shoot straight back to resistance on big volume then form a mini bull flag (drift sideways) as it digests the resistance level before moving higher. It’s this price action here that was screaming at me to go short.
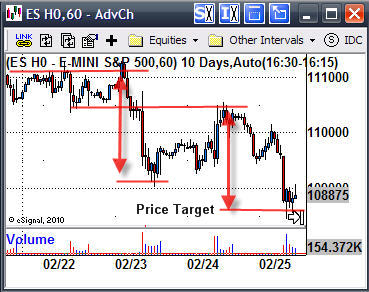
SP500 Mini – 60 Minute Intraday Trading Chart
The 60 minute chart helps me to clearly measure how much potential there is for this trade. If you understand technical analysis you will know how to calculate a measured move. It’s simple really.
Take the previous move and add it to the where you think the price is headed. I’ve shown it in the chart below.
Trading Time Frames Conclusion:
Well there you have it. I hope this report answers some basic trading questions.
If you would like to learn and trade at the same time I will be launching a service where I provide all my personal trades and analysis for your to follow along in real-time. Members will receive all my intraday and swing trade alerts for stocks, indexes and commodities allowing you to trade which ever vehicle you want whether it’s a high beta stock, leveraged etf, futures contract or cfd. This way your timing is accurate and you can trade which ever investment you are comfortable trading with.
There will be a 24/7 chat-room allowing us to trade around the clock when setups arise. Also, members can swap ideas, ask me questions, make new trading buddies etc… There is even a squawk box feature! When I talk everyone logged into the site can hear me for important news or trades alerts.
All trade alerts are instantly posted in the members area, chat-room and sent via email making it one of the most powerful trading services I have seen available online.
If you are interested please fill out the form to be notified for this service. It will have limited availability:
Get my Free Weekly ETF Trading Reports at www.GoldAndOilGuy.com
Hello, I'm Chris Vermeulen founder of TheGoldAndOilGuy and NOW is YOUR Opportunity to start trading GOLD, SILVER & OIL for BIG PROFITS. Let me help you get started.
To Your Financial Success,
By Chris Vermeulen
Chris@TheGoldAndOilGuy.com
Please visit my website for more information. http://www.TheGoldAndOilGuy.com
Chris Vermeulen is Founder of the popular trading site TheGoldAndOilGuy.com. There he shares his highly successful, low-risk trading method. For 6 years Chris has been a leader in teaching others to skillfully trade in gold, oil, and silver in both bull and bear markets. Subscribers to his service depend on Chris' uniquely consistent investment opportunities that carry exceptionally low risk and high return.
This article is intended solely for information purposes. The opinions are those of the author only. Please conduct further research and consult your financial advisor before making any investment/trading decision. No responsibility can be accepted for losses that may result as a consequence of trading on the basis of this analysis.
Chris Vermeulen Archive |
© 2005-2022 http://www.MarketOracle.co.uk - The Market Oracle is a FREE Daily Financial Markets Analysis & Forecasting online publication.